Chippewa vs Crow Master's Degree
COMPARE
Chippewa
Crow
Master's Degree
Master's Degree Comparison
Chippewa
Crow
11.4%
MASTER'S DEGREE
0.1/ 100
METRIC RATING
300th/ 347
METRIC RANK
10.6%
MASTER'S DEGREE
0.0/ 100
METRIC RATING
323rd/ 347
METRIC RANK
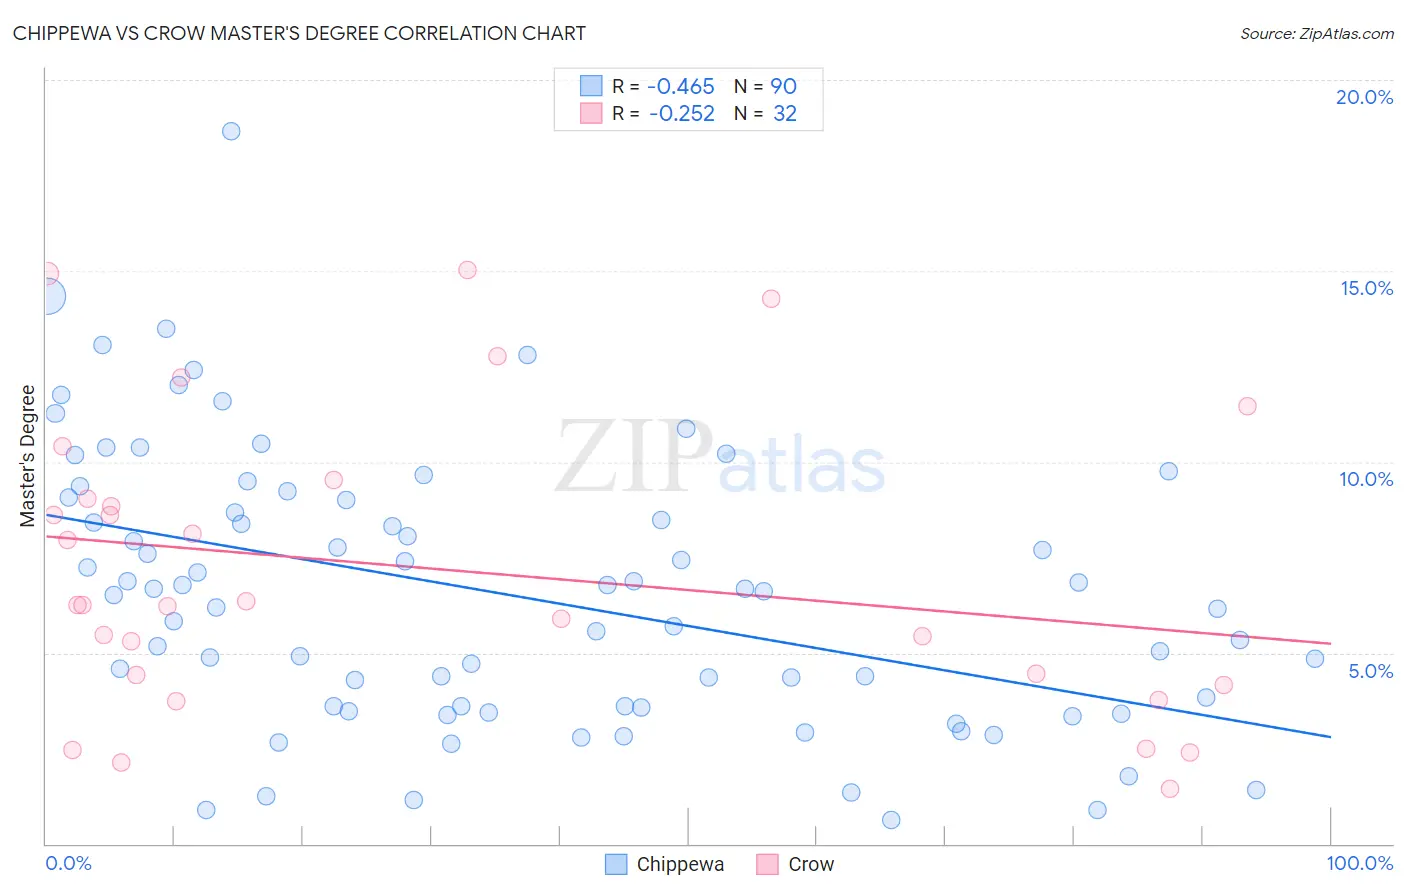
Chippewa vs Crow Master's Degree Correlation Chart
The statistical analysis conducted on geographies consisting of 215,015,908 people shows a moderate negative correlation between the proportion of Chippewa and percentage of population with at least master's degree education in the United States with a correlation coefficient (R) of -0.465 and weighted average of 11.4%. Similarly, the statistical analysis conducted on geographies consisting of 59,200,277 people shows a weak negative correlation between the proportion of Crow and percentage of population with at least master's degree education in the United States with a correlation coefficient (R) of -0.252 and weighted average of 10.6%, a difference of 7.4%.
Master's Degree Correlation Summary
| Measurement | Chippewa | Crow |
| Minimum | 0.64% | 1.4% |
| Maximum | 18.7% | 15.0% |
| Range | 18.0% | 13.6% |
| Mean | 6.5% | 7.2% |
| Median | 6.6% | 6.2% |
| Interquartile 25% (IQ1) | 3.6% | 4.3% |
| Interquartile 75% (IQ3) | 9.0% | 9.3% |
| Interquartile Range (IQR) | 5.4% | 5.0% |
| Standard Deviation (Sample) | 3.6% | 3.9% |
| Standard Deviation (Population) | 3.5% | 3.8% |
Similar Demographics by Master's Degree
Demographics Similar to Chippewa by Master's Degree
In terms of master's degree, the demographic groups most similar to Chippewa are Chickasaw (11.4%, a difference of 0.020%), Tsimshian (11.4%, a difference of 0.16%), Cherokee (11.4%, a difference of 0.47%), Samoan (11.5%, a difference of 0.48%), and Immigrants from Laos (11.4%, a difference of 0.49%).
| Demographics | Rating | Rank | Master's Degree |
| Alaska Natives | 0.1 /100 | #293 | Tragic 11.6% |
| Hawaiians | 0.1 /100 | #294 | Tragic 11.6% |
| Marshallese | 0.1 /100 | #295 | Tragic 11.6% |
| Alaskan Athabascans | 0.1 /100 | #296 | Tragic 11.6% |
| Immigrants | Yemen | 0.1 /100 | #297 | Tragic 11.6% |
| Samoans | 0.1 /100 | #298 | Tragic 11.5% |
| Chickasaw | 0.1 /100 | #299 | Tragic 11.4% |
| Chippewa | 0.1 /100 | #300 | Tragic 11.4% |
| Tsimshian | 0.1 /100 | #301 | Tragic 11.4% |
| Cherokee | 0.1 /100 | #302 | Tragic 11.4% |
| Immigrants | Laos | 0.1 /100 | #303 | Tragic 11.4% |
| Immigrants | Cabo Verde | 0.1 /100 | #304 | Tragic 11.3% |
| Immigrants | Latin America | 0.0 /100 | #305 | Tragic 11.3% |
| Mexican American Indians | 0.0 /100 | #306 | Tragic 11.2% |
| Cheyenne | 0.0 /100 | #307 | Tragic 11.2% |
Demographics Similar to Crow by Master's Degree
In terms of master's degree, the demographic groups most similar to Crow are Dutch West Indian (10.6%, a difference of 0.040%), Sioux (10.7%, a difference of 0.39%), Pennsylvania German (10.7%, a difference of 1.0%), Inupiat (10.5%, a difference of 1.1%), and Creek (10.5%, a difference of 1.1%).
| Demographics | Rating | Rank | Master's Degree |
| Hispanics or Latinos | 0.0 /100 | #316 | Tragic 10.9% |
| Hopi | 0.0 /100 | #317 | Tragic 10.9% |
| Immigrants | Cuba | 0.0 /100 | #318 | Tragic 10.9% |
| Kiowa | 0.0 /100 | #319 | Tragic 10.8% |
| Immigrants | Micronesia | 0.0 /100 | #320 | Tragic 10.8% |
| Pennsylvania Germans | 0.0 /100 | #321 | Tragic 10.7% |
| Sioux | 0.0 /100 | #322 | Tragic 10.7% |
| Crow | 0.0 /100 | #323 | Tragic 10.6% |
| Dutch West Indians | 0.0 /100 | #324 | Tragic 10.6% |
| Inupiat | 0.0 /100 | #325 | Tragic 10.5% |
| Creek | 0.0 /100 | #326 | Tragic 10.5% |
| Paiute | 0.0 /100 | #327 | Tragic 10.5% |
| Bangladeshis | 0.0 /100 | #328 | Tragic 10.5% |
| Nepalese | 0.0 /100 | #329 | Tragic 10.5% |
| Fijians | 0.0 /100 | #330 | Tragic 10.3% |