Chinese vs Immigrants from Eastern Europe Hearing Disability
COMPARE
Chinese
Immigrants from Eastern Europe
Hearing Disability
Hearing Disability Comparison
Chinese
Immigrants from Eastern Europe
3.7%
HEARING DISABILITY
0.0/ 100
METRIC RATING
289th/ 347
METRIC RANK
3.0%
HEARING DISABILITY
58.1/ 100
METRIC RATING
167th/ 347
METRIC RANK
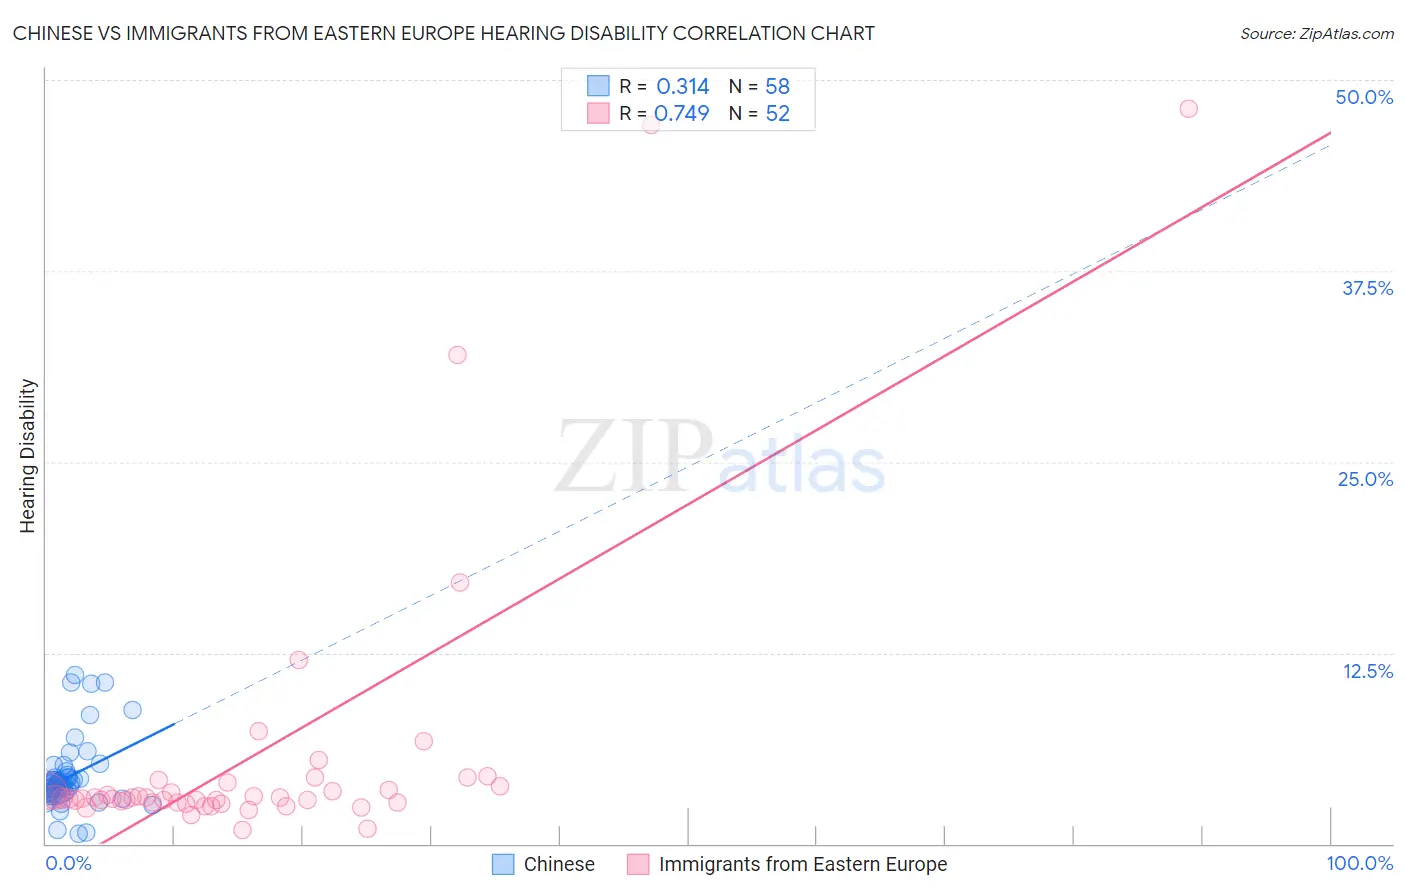
Chinese vs Immigrants from Eastern Europe Hearing Disability Correlation Chart
The statistical analysis conducted on geographies consisting of 64,801,631 people shows a mild positive correlation between the proportion of Chinese and percentage of population with hearing disability in the United States with a correlation coefficient (R) of 0.314 and weighted average of 3.7%. Similarly, the statistical analysis conducted on geographies consisting of 475,611,830 people shows a strong positive correlation between the proportion of Immigrants from Eastern Europe and percentage of population with hearing disability in the United States with a correlation coefficient (R) of 0.749 and weighted average of 3.0%, a difference of 23.8%.
Hearing Disability Correlation Summary
| Measurement | Chinese | Immigrants from Eastern Europe |
| Minimum | 0.63% | 0.94% |
| Maximum | 11.0% | 48.1% |
| Range | 10.4% | 47.2% |
| Mean | 4.4% | 5.9% |
| Median | 3.9% | 3.0% |
| Interquartile 25% (IQ1) | 3.3% | 2.7% |
| Interquartile 75% (IQ3) | 4.4% | 3.9% |
| Interquartile Range (IQR) | 1.1% | 1.2% |
| Standard Deviation (Sample) | 2.2% | 9.6% |
| Standard Deviation (Population) | 2.2% | 9.5% |
Similar Demographics by Hearing Disability
Demographics Similar to Chinese by Hearing Disability
In terms of hearing disability, the demographic groups most similar to Chinese are White/Caucasian (3.7%, a difference of 0.13%), Finnish (3.7%, a difference of 0.15%), Irish (3.7%, a difference of 0.21%), Native Hawaiian (3.7%, a difference of 0.21%), and Norwegian (3.7%, a difference of 0.27%).
| Demographics | Rating | Rank | Hearing Disability |
| Swedes | 0.0 /100 | #282 | Tragic 3.6% |
| Blackfeet | 0.0 /100 | #283 | Tragic 3.6% |
| Immigrants | Micronesia | 0.0 /100 | #284 | Tragic 3.6% |
| Sioux | 0.0 /100 | #285 | Tragic 3.6% |
| Delaware | 0.0 /100 | #286 | Tragic 3.6% |
| Spanish | 0.0 /100 | #287 | Tragic 3.7% |
| Irish | 0.0 /100 | #288 | Tragic 3.7% |
| Chinese | 0.0 /100 | #289 | Tragic 3.7% |
| Whites/Caucasians | 0.0 /100 | #290 | Tragic 3.7% |
| Finns | 0.0 /100 | #291 | Tragic 3.7% |
| Native Hawaiians | 0.0 /100 | #292 | Tragic 3.7% |
| Norwegians | 0.0 /100 | #293 | Tragic 3.7% |
| Iroquois | 0.0 /100 | #294 | Tragic 3.7% |
| Welsh | 0.0 /100 | #295 | Tragic 3.7% |
| Pima | 0.0 /100 | #296 | Tragic 3.7% |
Demographics Similar to Immigrants from Eastern Europe by Hearing Disability
In terms of hearing disability, the demographic groups most similar to Immigrants from Eastern Europe are Immigrants from Greece (3.0%, a difference of 0.020%), Arab (3.0%, a difference of 0.040%), Immigrants from Cabo Verde (3.0%, a difference of 0.11%), Immigrants from Ukraine (3.0%, a difference of 0.14%), and Armenian (3.0%, a difference of 0.20%).
| Demographics | Rating | Rank | Hearing Disability |
| Immigrants | Fiji | 67.1 /100 | #160 | Good 2.9% |
| Albanians | 66.6 /100 | #161 | Good 2.9% |
| Immigrants | Japan | 66.3 /100 | #162 | Good 2.9% |
| Immigrants | Central America | 64.9 /100 | #163 | Good 3.0% |
| Immigrants | Cambodia | 64.8 /100 | #164 | Good 3.0% |
| Immigrants | Zimbabwe | 64.2 /100 | #165 | Good 3.0% |
| Immigrants | South Eastern Asia | 62.9 /100 | #166 | Good 3.0% |
| Immigrants | Eastern Europe | 58.1 /100 | #167 | Average 3.0% |
| Immigrants | Greece | 57.9 /100 | #168 | Average 3.0% |
| Arabs | 57.6 /100 | #169 | Average 3.0% |
| Immigrants | Cabo Verde | 56.9 /100 | #170 | Average 3.0% |
| Immigrants | Ukraine | 56.6 /100 | #171 | Average 3.0% |
| Armenians | 56.0 /100 | #172 | Average 3.0% |
| Immigrants | Serbia | 51.1 /100 | #173 | Average 3.0% |
| Indonesians | 50.0 /100 | #174 | Average 3.0% |