Chinese vs Immigrants from Jamaica Hearing Disability
COMPARE
Chinese
Immigrants from Jamaica
Hearing Disability
Hearing Disability Comparison
Chinese
Immigrants from Jamaica
3.7%
HEARING DISABILITY
0.0/ 100
METRIC RATING
289th/ 347
METRIC RANK
2.6%
HEARING DISABILITY
99.5/ 100
METRIC RATING
38th/ 347
METRIC RANK
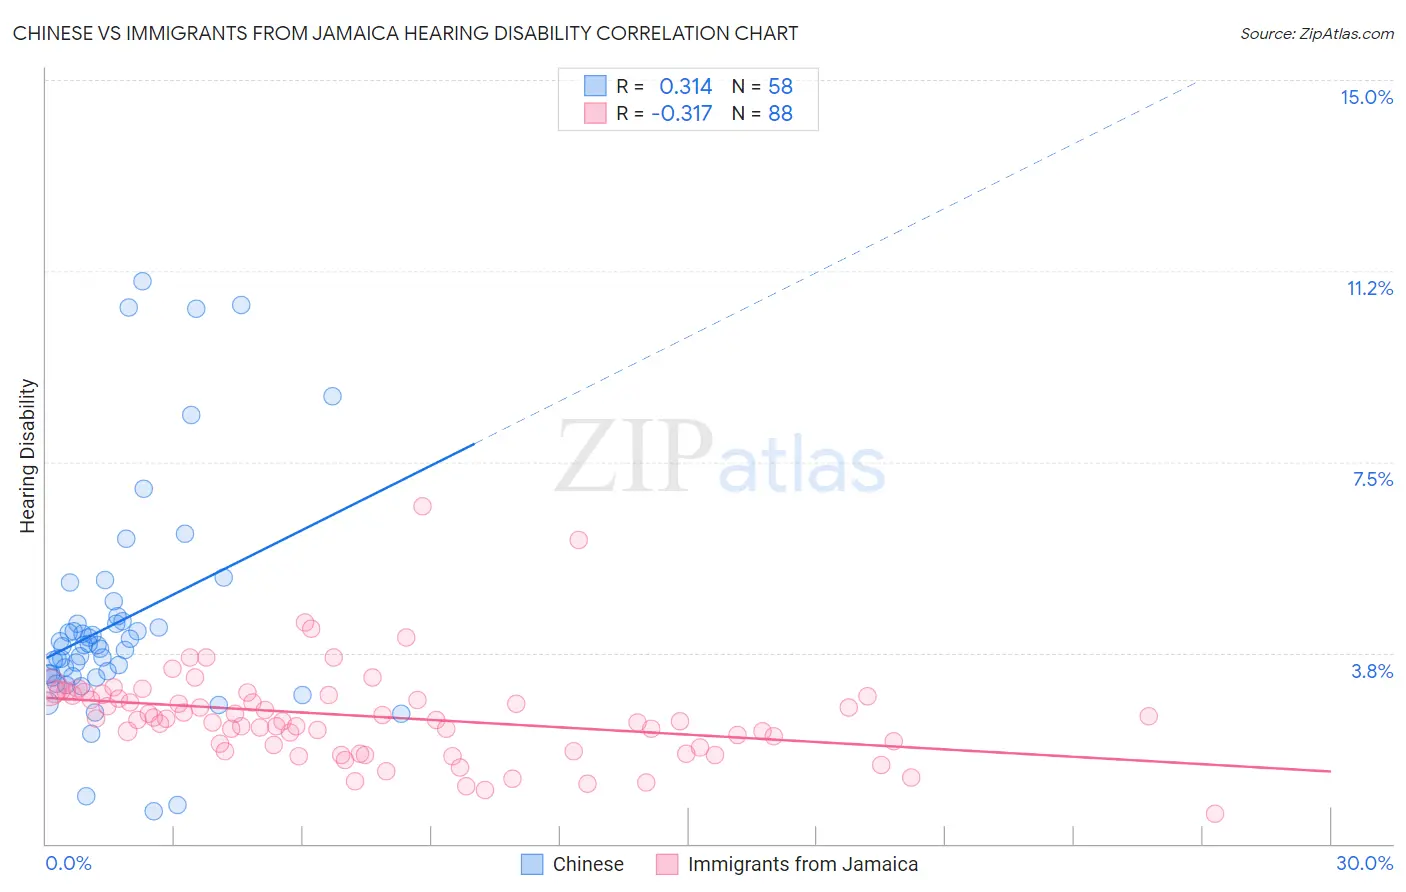
Chinese vs Immigrants from Jamaica Hearing Disability Correlation Chart
The statistical analysis conducted on geographies consisting of 64,801,631 people shows a mild positive correlation between the proportion of Chinese and percentage of population with hearing disability in the United States with a correlation coefficient (R) of 0.314 and weighted average of 3.7%. Similarly, the statistical analysis conducted on geographies consisting of 301,631,543 people shows a mild negative correlation between the proportion of Immigrants from Jamaica and percentage of population with hearing disability in the United States with a correlation coefficient (R) of -0.317 and weighted average of 2.6%, a difference of 40.6%.
Hearing Disability Correlation Summary
| Measurement | Chinese | Immigrants from Jamaica |
| Minimum | 0.63% | 0.58% |
| Maximum | 11.0% | 6.6% |
| Range | 10.4% | 6.0% |
| Mean | 4.4% | 2.5% |
| Median | 3.9% | 2.4% |
| Interquartile 25% (IQ1) | 3.3% | 1.9% |
| Interquartile 75% (IQ3) | 4.4% | 2.9% |
| Interquartile Range (IQR) | 1.1% | 1.0% |
| Standard Deviation (Sample) | 2.2% | 0.92% |
| Standard Deviation (Population) | 2.2% | 0.92% |
Similar Demographics by Hearing Disability
Demographics Similar to Chinese by Hearing Disability
In terms of hearing disability, the demographic groups most similar to Chinese are White/Caucasian (3.7%, a difference of 0.13%), Finnish (3.7%, a difference of 0.15%), Irish (3.7%, a difference of 0.21%), Native Hawaiian (3.7%, a difference of 0.21%), and Norwegian (3.7%, a difference of 0.27%).
| Demographics | Rating | Rank | Hearing Disability |
| Swedes | 0.0 /100 | #282 | Tragic 3.6% |
| Blackfeet | 0.0 /100 | #283 | Tragic 3.6% |
| Immigrants | Micronesia | 0.0 /100 | #284 | Tragic 3.6% |
| Sioux | 0.0 /100 | #285 | Tragic 3.6% |
| Delaware | 0.0 /100 | #286 | Tragic 3.6% |
| Spanish | 0.0 /100 | #287 | Tragic 3.7% |
| Irish | 0.0 /100 | #288 | Tragic 3.7% |
| Chinese | 0.0 /100 | #289 | Tragic 3.7% |
| Whites/Caucasians | 0.0 /100 | #290 | Tragic 3.7% |
| Finns | 0.0 /100 | #291 | Tragic 3.7% |
| Native Hawaiians | 0.0 /100 | #292 | Tragic 3.7% |
| Norwegians | 0.0 /100 | #293 | Tragic 3.7% |
| Iroquois | 0.0 /100 | #294 | Tragic 3.7% |
| Welsh | 0.0 /100 | #295 | Tragic 3.7% |
| Pima | 0.0 /100 | #296 | Tragic 3.7% |
Demographics Similar to Immigrants from Jamaica by Hearing Disability
In terms of hearing disability, the demographic groups most similar to Immigrants from Jamaica are Immigrants from Western Africa (2.6%, a difference of 0.080%), Okinawan (2.6%, a difference of 0.11%), Immigrants from China (2.6%, a difference of 0.24%), Haitian (2.6%, a difference of 0.32%), and Salvadoran (2.6%, a difference of 0.33%).
| Demographics | Rating | Rank | Hearing Disability |
| Immigrants | Cameroon | 99.7 /100 | #31 | Exceptional 2.6% |
| Immigrants | Venezuela | 99.7 /100 | #32 | Exceptional 2.6% |
| Filipinos | 99.6 /100 | #33 | Exceptional 2.6% |
| Immigrants | Pakistan | 99.6 /100 | #34 | Exceptional 2.6% |
| Salvadorans | 99.6 /100 | #35 | Exceptional 2.6% |
| Okinawans | 99.6 /100 | #36 | Exceptional 2.6% |
| Immigrants | Western Africa | 99.6 /100 | #37 | Exceptional 2.6% |
| Immigrants | Jamaica | 99.5 /100 | #38 | Exceptional 2.6% |
| Immigrants | China | 99.5 /100 | #39 | Exceptional 2.6% |
| Haitians | 99.5 /100 | #40 | Exceptional 2.6% |
| Immigrants | Taiwan | 99.4 /100 | #41 | Exceptional 2.6% |
| West Indians | 99.4 /100 | #42 | Exceptional 2.6% |
| Senegalese | 99.4 /100 | #43 | Exceptional 2.6% |
| Nigerians | 99.4 /100 | #44 | Exceptional 2.6% |
| Venezuelans | 99.4 /100 | #45 | Exceptional 2.6% |