Chinese vs Lithuanian Hearing Disability
COMPARE
Chinese
Lithuanian
Hearing Disability
Hearing Disability Comparison
Chinese
Lithuanians
3.7%
HEARING DISABILITY
0.0/ 100
METRIC RATING
289th/ 347
METRIC RANK
3.4%
HEARING DISABILITY
0.6/ 100
METRIC RATING
247th/ 347
METRIC RANK
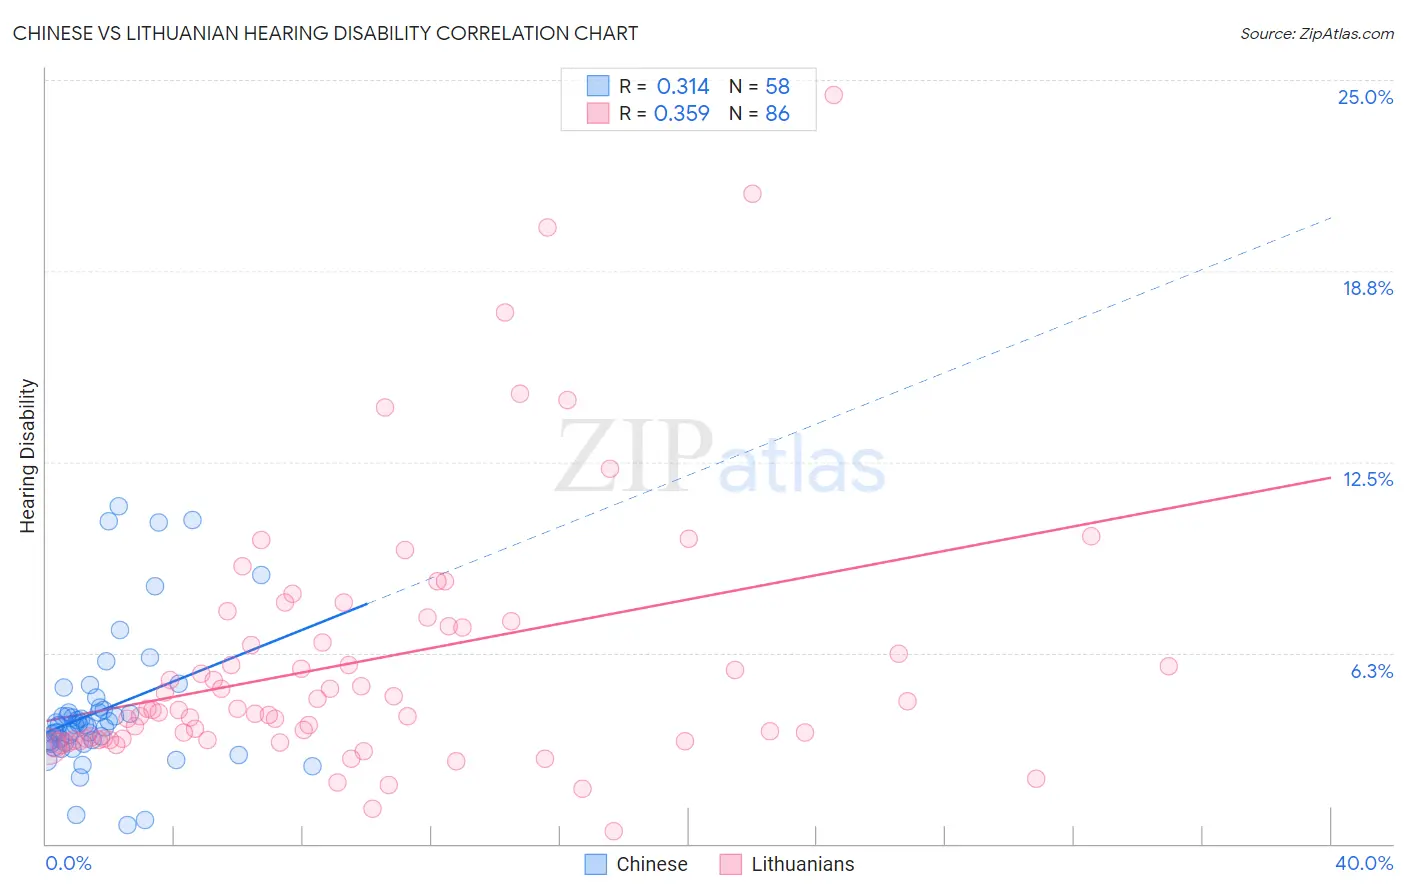
Chinese vs Lithuanian Hearing Disability Correlation Chart
The statistical analysis conducted on geographies consisting of 64,801,631 people shows a mild positive correlation between the proportion of Chinese and percentage of population with hearing disability in the United States with a correlation coefficient (R) of 0.314 and weighted average of 3.7%. Similarly, the statistical analysis conducted on geographies consisting of 421,806,281 people shows a mild positive correlation between the proportion of Lithuanians and percentage of population with hearing disability in the United States with a correlation coefficient (R) of 0.359 and weighted average of 3.4%, a difference of 9.8%.
Hearing Disability Correlation Summary
| Measurement | Chinese | Lithuanian |
| Minimum | 0.63% | 0.40% |
| Maximum | 11.0% | 24.5% |
| Range | 10.4% | 24.1% |
| Mean | 4.4% | 6.0% |
| Median | 3.9% | 4.4% |
| Interquartile 25% (IQ1) | 3.3% | 3.4% |
| Interquartile 75% (IQ3) | 4.4% | 7.1% |
| Interquartile Range (IQR) | 1.1% | 3.7% |
| Standard Deviation (Sample) | 2.2% | 4.4% |
| Standard Deviation (Population) | 2.2% | 4.3% |
Similar Demographics by Hearing Disability
Demographics Similar to Chinese by Hearing Disability
In terms of hearing disability, the demographic groups most similar to Chinese are White/Caucasian (3.7%, a difference of 0.13%), Finnish (3.7%, a difference of 0.15%), Irish (3.7%, a difference of 0.21%), Native Hawaiian (3.7%, a difference of 0.21%), and Norwegian (3.7%, a difference of 0.27%).
| Demographics | Rating | Rank | Hearing Disability |
| Swedes | 0.0 /100 | #282 | Tragic 3.6% |
| Blackfeet | 0.0 /100 | #283 | Tragic 3.6% |
| Immigrants | Micronesia | 0.0 /100 | #284 | Tragic 3.6% |
| Sioux | 0.0 /100 | #285 | Tragic 3.6% |
| Delaware | 0.0 /100 | #286 | Tragic 3.6% |
| Spanish | 0.0 /100 | #287 | Tragic 3.7% |
| Irish | 0.0 /100 | #288 | Tragic 3.7% |
| Chinese | 0.0 /100 | #289 | Tragic 3.7% |
| Whites/Caucasians | 0.0 /100 | #290 | Tragic 3.7% |
| Finns | 0.0 /100 | #291 | Tragic 3.7% |
| Native Hawaiians | 0.0 /100 | #292 | Tragic 3.7% |
| Norwegians | 0.0 /100 | #293 | Tragic 3.7% |
| Iroquois | 0.0 /100 | #294 | Tragic 3.7% |
| Welsh | 0.0 /100 | #295 | Tragic 3.7% |
| Pima | 0.0 /100 | #296 | Tragic 3.7% |
Demographics Similar to Lithuanians by Hearing Disability
In terms of hearing disability, the demographic groups most similar to Lithuanians are Immigrants from England (3.3%, a difference of 0.20%), Austrian (3.4%, a difference of 0.22%), Immigrants from Scotland (3.3%, a difference of 0.48%), Italian (3.4%, a difference of 0.75%), and Yuman (3.4%, a difference of 0.76%).
| Demographics | Rating | Rank | Hearing Disability |
| Immigrants | Netherlands | 1.1 /100 | #240 | Tragic 3.3% |
| Samoans | 1.1 /100 | #241 | Tragic 3.3% |
| Yugoslavians | 1.0 /100 | #242 | Tragic 3.3% |
| Immigrants | Western Europe | 1.0 /100 | #243 | Tragic 3.3% |
| Assyrians/Chaldeans/Syriacs | 0.9 /100 | #244 | Tragic 3.3% |
| Immigrants | Scotland | 0.8 /100 | #245 | Tragic 3.3% |
| Immigrants | England | 0.7 /100 | #246 | Tragic 3.3% |
| Lithuanians | 0.6 /100 | #247 | Tragic 3.4% |
| Austrians | 0.6 /100 | #248 | Tragic 3.4% |
| Italians | 0.4 /100 | #249 | Tragic 3.4% |
| Yuman | 0.4 /100 | #250 | Tragic 3.4% |
| Hungarians | 0.4 /100 | #251 | Tragic 3.4% |
| Croatians | 0.4 /100 | #252 | Tragic 3.4% |
| Carpatho Rusyns | 0.3 /100 | #253 | Tragic 3.4% |
| Slavs | 0.2 /100 | #254 | Tragic 3.4% |