Tlingit-Haida vs Immigrants from Eastern Europe Hearing Disability
COMPARE
Tlingit-Haida
Immigrants from Eastern Europe
Hearing Disability
Hearing Disability Comparison
Tlingit-Haida
Immigrants from Eastern Europe
4.8%
HEARING DISABILITY
0.0/ 100
METRIC RATING
344th/ 347
METRIC RANK
3.0%
HEARING DISABILITY
58.1/ 100
METRIC RATING
167th/ 347
METRIC RANK
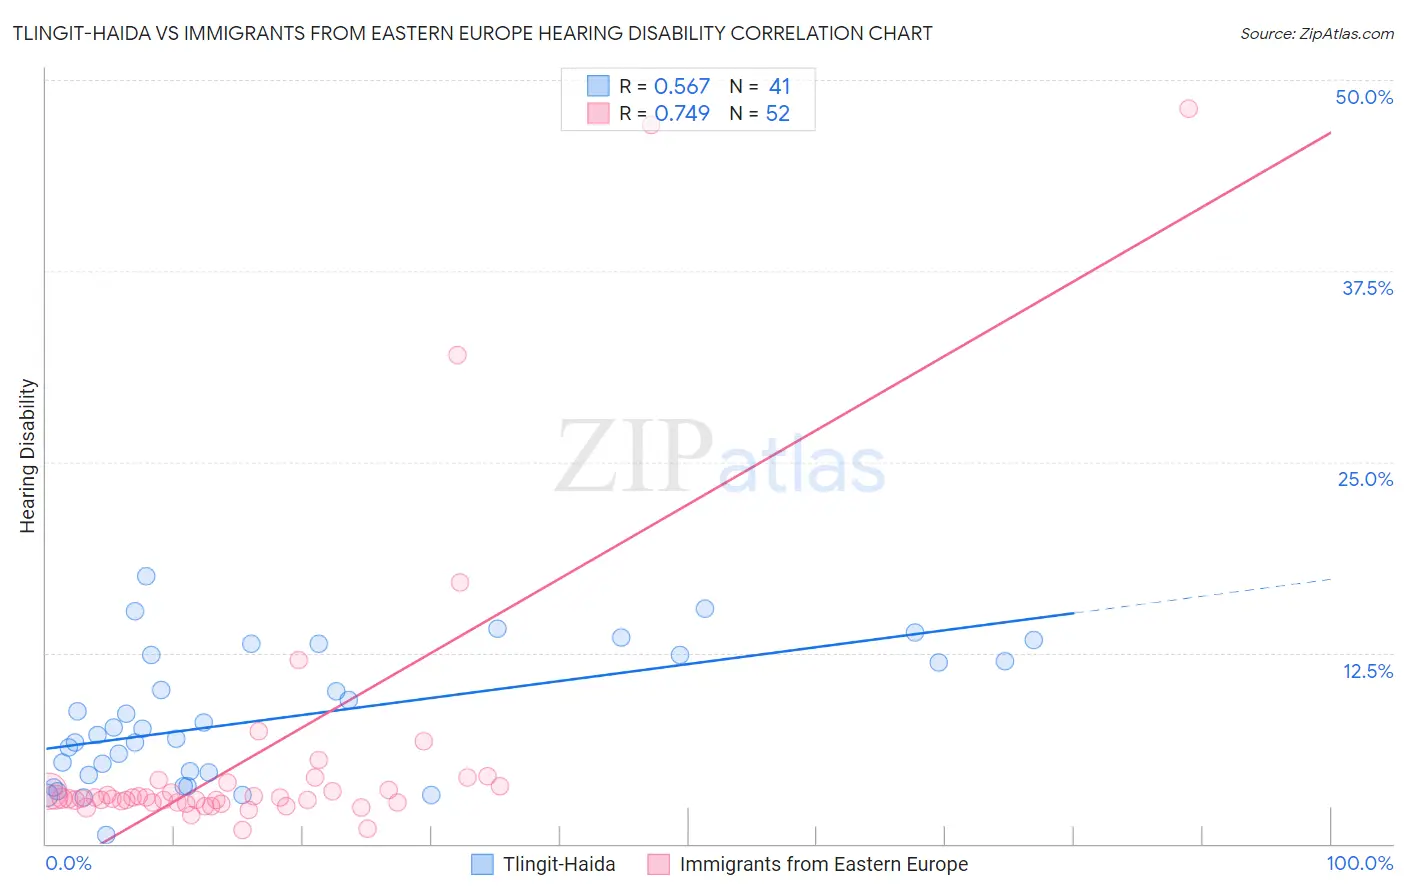
Tlingit-Haida vs Immigrants from Eastern Europe Hearing Disability Correlation Chart
The statistical analysis conducted on geographies consisting of 60,852,790 people shows a substantial positive correlation between the proportion of Tlingit-Haida and percentage of population with hearing disability in the United States with a correlation coefficient (R) of 0.567 and weighted average of 4.8%. Similarly, the statistical analysis conducted on geographies consisting of 475,611,830 people shows a strong positive correlation between the proportion of Immigrants from Eastern Europe and percentage of population with hearing disability in the United States with a correlation coefficient (R) of 0.749 and weighted average of 3.0%, a difference of 62.9%.
Hearing Disability Correlation Summary
| Measurement | Tlingit-Haida | Immigrants from Eastern Europe |
| Minimum | 0.61% | 0.94% |
| Maximum | 17.5% | 48.1% |
| Range | 16.9% | 47.2% |
| Mean | 8.3% | 5.9% |
| Median | 7.5% | 3.0% |
| Interquartile 25% (IQ1) | 4.6% | 2.7% |
| Interquartile 75% (IQ3) | 12.4% | 3.9% |
| Interquartile Range (IQR) | 7.8% | 1.2% |
| Standard Deviation (Sample) | 4.3% | 9.6% |
| Standard Deviation (Population) | 4.3% | 9.5% |
Similar Demographics by Hearing Disability
Demographics Similar to Tlingit-Haida by Hearing Disability
In terms of hearing disability, the demographic groups most similar to Tlingit-Haida are Inupiat (4.7%, a difference of 2.7%), Tsimshian (4.7%, a difference of 2.9%), Navajo (4.6%, a difference of 4.5%), Pueblo (4.6%, a difference of 4.9%), and Choctaw (4.5%, a difference of 6.4%).
| Demographics | Rating | Rank | Hearing Disability |
| Dutch West Indians | 0.0 /100 | #333 | Tragic 4.3% |
| Aleuts | 0.0 /100 | #334 | Tragic 4.3% |
| Kiowa | 0.0 /100 | #335 | Tragic 4.3% |
| Creek | 0.0 /100 | #336 | Tragic 4.4% |
| Chickasaw | 0.0 /100 | #337 | Tragic 4.5% |
| Alaska Natives | 0.0 /100 | #338 | Tragic 4.5% |
| Choctaw | 0.0 /100 | #339 | Tragic 4.5% |
| Pueblo | 0.0 /100 | #340 | Tragic 4.6% |
| Navajo | 0.0 /100 | #341 | Tragic 4.6% |
| Tsimshian | 0.0 /100 | #342 | Tragic 4.7% |
| Inupiat | 0.0 /100 | #343 | Tragic 4.7% |
| Tlingit-Haida | 0.0 /100 | #344 | Tragic 4.8% |
| Alaskan Athabascans | 0.0 /100 | #345 | Tragic 5.3% |
| Colville | 0.0 /100 | #346 | Tragic 5.3% |
| Yup'ik | 0.0 /100 | #347 | Tragic 5.8% |
Demographics Similar to Immigrants from Eastern Europe by Hearing Disability
In terms of hearing disability, the demographic groups most similar to Immigrants from Eastern Europe are Immigrants from Greece (3.0%, a difference of 0.020%), Arab (3.0%, a difference of 0.040%), Immigrants from Cabo Verde (3.0%, a difference of 0.11%), Immigrants from Ukraine (3.0%, a difference of 0.14%), and Armenian (3.0%, a difference of 0.20%).
| Demographics | Rating | Rank | Hearing Disability |
| Immigrants | Fiji | 67.1 /100 | #160 | Good 2.9% |
| Albanians | 66.6 /100 | #161 | Good 2.9% |
| Immigrants | Japan | 66.3 /100 | #162 | Good 2.9% |
| Immigrants | Central America | 64.9 /100 | #163 | Good 3.0% |
| Immigrants | Cambodia | 64.8 /100 | #164 | Good 3.0% |
| Immigrants | Zimbabwe | 64.2 /100 | #165 | Good 3.0% |
| Immigrants | South Eastern Asia | 62.9 /100 | #166 | Good 3.0% |
| Immigrants | Eastern Europe | 58.1 /100 | #167 | Average 3.0% |
| Immigrants | Greece | 57.9 /100 | #168 | Average 3.0% |
| Arabs | 57.6 /100 | #169 | Average 3.0% |
| Immigrants | Cabo Verde | 56.9 /100 | #170 | Average 3.0% |
| Immigrants | Ukraine | 56.6 /100 | #171 | Average 3.0% |
| Armenians | 56.0 /100 | #172 | Average 3.0% |
| Immigrants | Serbia | 51.1 /100 | #173 | Average 3.0% |
| Indonesians | 50.0 /100 | #174 | Average 3.0% |