Immigrants vs Immigrants from Eastern Europe Hearing Disability
COMPARE
Immigrants
Immigrants from Eastern Europe
Hearing Disability
Hearing Disability Comparison
Immigrants
Immigrants from Eastern Europe
2.8%
HEARING DISABILITY
90.3/ 100
METRIC RATING
116th/ 347
METRIC RANK
3.0%
HEARING DISABILITY
58.1/ 100
METRIC RATING
167th/ 347
METRIC RANK
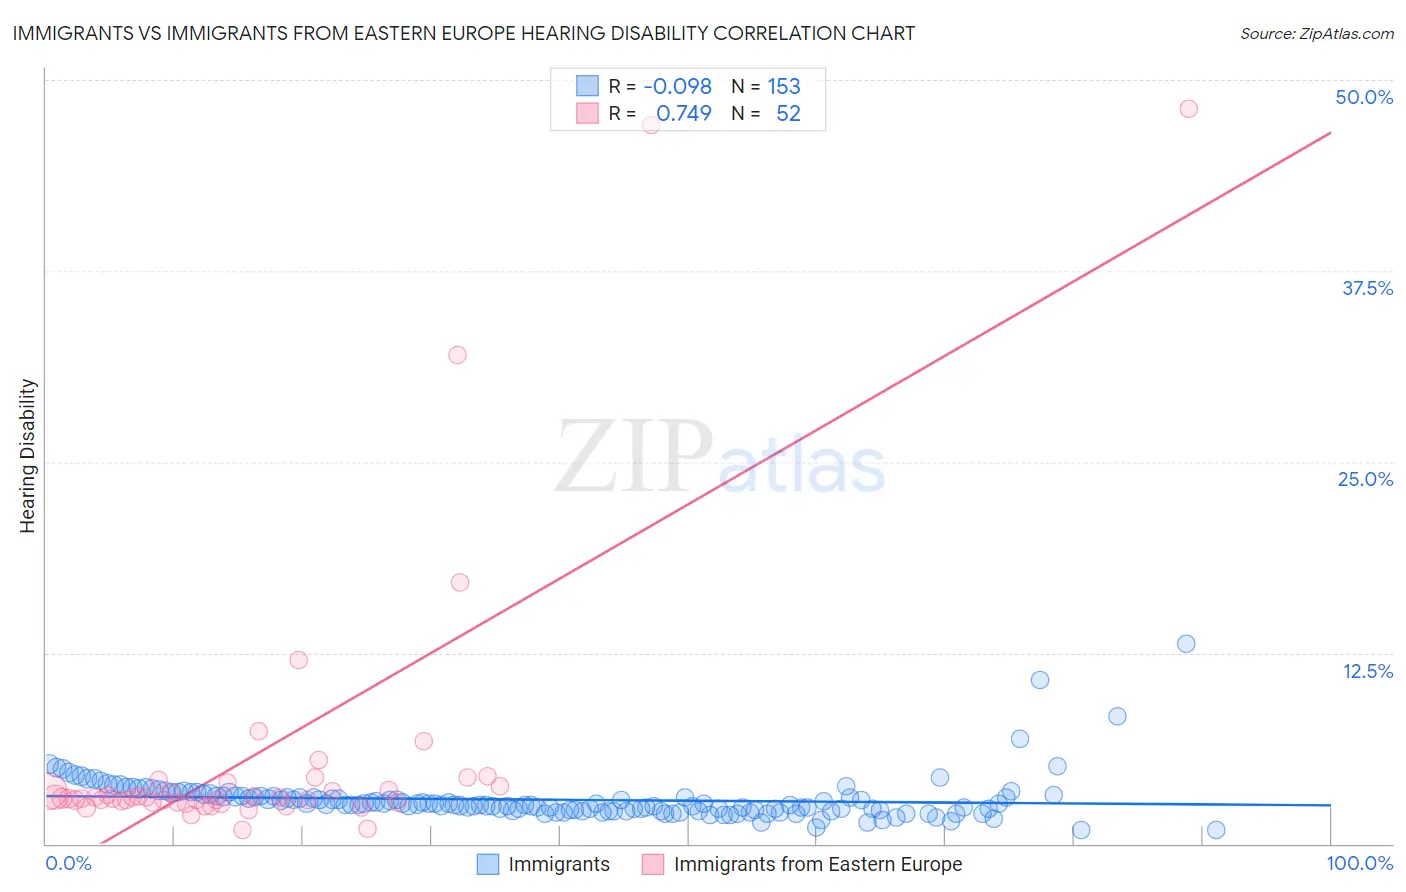
Immigrants vs Immigrants from Eastern Europe Hearing Disability Correlation Chart
The statistical analysis conducted on geographies consisting of 576,876,891 people shows a slight negative correlation between the proportion of Immigrants and percentage of population with hearing disability in the United States with a correlation coefficient (R) of -0.098 and weighted average of 2.8%. Similarly, the statistical analysis conducted on geographies consisting of 475,611,830 people shows a strong positive correlation between the proportion of Immigrants from Eastern Europe and percentage of population with hearing disability in the United States with a correlation coefficient (R) of 0.749 and weighted average of 3.0%, a difference of 4.7%.
Hearing Disability Correlation Summary
| Measurement | Immigrants | Immigrants from Eastern Europe |
| Minimum | 0.87% | 0.94% |
| Maximum | 13.1% | 48.1% |
| Range | 12.2% | 47.2% |
| Mean | 2.9% | 5.9% |
| Median | 2.6% | 3.0% |
| Interquartile 25% (IQ1) | 2.2% | 2.7% |
| Interquartile 75% (IQ3) | 3.1% | 3.9% |
| Interquartile Range (IQR) | 0.95% | 1.2% |
| Standard Deviation (Sample) | 1.4% | 9.6% |
| Standard Deviation (Population) | 1.4% | 9.5% |
Similar Demographics by Hearing Disability
Demographics Similar to Immigrants by Hearing Disability
In terms of hearing disability, the demographic groups most similar to Immigrants are Immigrants from Latin America (2.8%, a difference of 0.060%), Immigrants from Liberia (2.8%, a difference of 0.090%), Zimbabwean (2.8%, a difference of 0.10%), Kenyan (2.8%, a difference of 0.12%), and Jordanian (2.8%, a difference of 0.21%).
| Demographics | Rating | Rank | Hearing Disability |
| Turks | 93.0 /100 | #109 | Exceptional 2.8% |
| Cypriots | 92.9 /100 | #110 | Exceptional 2.8% |
| Immigrants | Yemen | 92.7 /100 | #111 | Exceptional 2.8% |
| U.S. Virgin Islanders | 92.5 /100 | #112 | Exceptional 2.8% |
| Immigrants | Belarus | 91.6 /100 | #113 | Exceptional 2.8% |
| Cambodians | 91.1 /100 | #114 | Exceptional 2.8% |
| Immigrants | Latin America | 90.5 /100 | #115 | Exceptional 2.8% |
| Immigrants | Immigrants | 90.3 /100 | #116 | Exceptional 2.8% |
| Immigrants | Liberia | 90.0 /100 | #117 | Excellent 2.8% |
| Zimbabweans | 89.9 /100 | #118 | Excellent 2.8% |
| Kenyans | 89.8 /100 | #119 | Excellent 2.8% |
| Jordanians | 89.5 /100 | #120 | Excellent 2.8% |
| Cubans | 89.4 /100 | #121 | Excellent 2.8% |
| Liberians | 89.0 /100 | #122 | Excellent 2.8% |
| Immigrants | Zaire | 88.6 /100 | #123 | Excellent 2.9% |
Demographics Similar to Immigrants from Eastern Europe by Hearing Disability
In terms of hearing disability, the demographic groups most similar to Immigrants from Eastern Europe are Immigrants from Greece (3.0%, a difference of 0.020%), Arab (3.0%, a difference of 0.040%), Immigrants from Cabo Verde (3.0%, a difference of 0.11%), Immigrants from Ukraine (3.0%, a difference of 0.14%), and Armenian (3.0%, a difference of 0.20%).
| Demographics | Rating | Rank | Hearing Disability |
| Immigrants | Fiji | 67.1 /100 | #160 | Good 2.9% |
| Albanians | 66.6 /100 | #161 | Good 2.9% |
| Immigrants | Japan | 66.3 /100 | #162 | Good 2.9% |
| Immigrants | Central America | 64.9 /100 | #163 | Good 3.0% |
| Immigrants | Cambodia | 64.8 /100 | #164 | Good 3.0% |
| Immigrants | Zimbabwe | 64.2 /100 | #165 | Good 3.0% |
| Immigrants | South Eastern Asia | 62.9 /100 | #166 | Good 3.0% |
| Immigrants | Eastern Europe | 58.1 /100 | #167 | Average 3.0% |
| Immigrants | Greece | 57.9 /100 | #168 | Average 3.0% |
| Arabs | 57.6 /100 | #169 | Average 3.0% |
| Immigrants | Cabo Verde | 56.9 /100 | #170 | Average 3.0% |
| Immigrants | Ukraine | 56.6 /100 | #171 | Average 3.0% |
| Armenians | 56.0 /100 | #172 | Average 3.0% |
| Immigrants | Serbia | 51.1 /100 | #173 | Average 3.0% |
| Indonesians | 50.0 /100 | #174 | Average 3.0% |