Chinese vs Immigrants from Eastern Europe GED/Equivalency
COMPARE
Chinese
Immigrants from Eastern Europe
GED/Equivalency
GED/Equivalency Comparison
Chinese
Immigrants from Eastern Europe
89.0%
GED/EQUIVALENCY
99.9/ 100
METRIC RATING
9th/ 347
METRIC RANK
87.1%
GED/EQUIVALENCY
95.5/ 100
METRIC RATING
109th/ 347
METRIC RANK
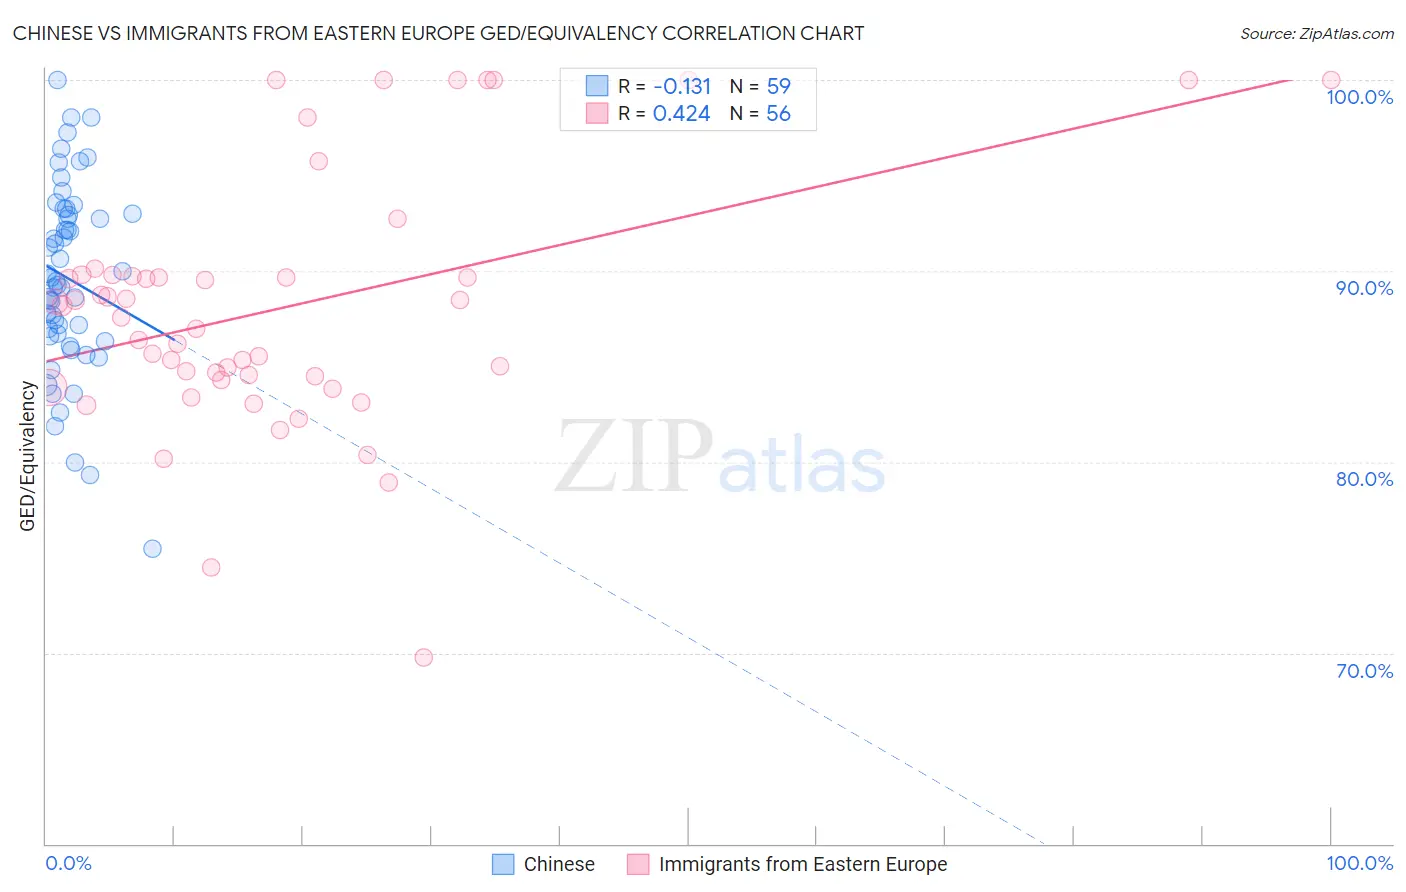
Chinese vs Immigrants from Eastern Europe GED/Equivalency Correlation Chart
The statistical analysis conducted on geographies consisting of 64,809,883 people shows a poor negative correlation between the proportion of Chinese and percentage of population with at least ged/equivalency education in the United States with a correlation coefficient (R) of -0.131 and weighted average of 89.0%. Similarly, the statistical analysis conducted on geographies consisting of 475,879,420 people shows a moderate positive correlation between the proportion of Immigrants from Eastern Europe and percentage of population with at least ged/equivalency education in the United States with a correlation coefficient (R) of 0.424 and weighted average of 87.1%, a difference of 2.2%.
GED/Equivalency Correlation Summary
| Measurement | Chinese | Immigrants from Eastern Europe |
| Minimum | 75.4% | 69.7% |
| Maximum | 100.0% | 100.0% |
| Range | 24.6% | 30.3% |
| Mean | 89.6% | 88.1% |
| Median | 89.4% | 87.9% |
| Interquartile 25% (IQ1) | 86.6% | 84.4% |
| Interquartile 75% (IQ3) | 93.0% | 89.7% |
| Interquartile Range (IQR) | 6.5% | 5.4% |
| Standard Deviation (Sample) | 4.9% | 6.6% |
| Standard Deviation (Population) | 4.9% | 6.5% |
Similar Demographics by GED/Equivalency
Demographics Similar to Chinese by GED/Equivalency
In terms of ged/equivalency, the demographic groups most similar to Chinese are Carpatho Rusyn (89.1%, a difference of 0.020%), Norwegian (89.0%, a difference of 0.040%), Eastern European (89.1%, a difference of 0.070%), Bulgarian (89.0%, a difference of 0.080%), and Thai (89.1%, a difference of 0.12%).
| Demographics | Rating | Rank | GED/Equivalency |
| Filipinos | 100.0 /100 | #2 | Exceptional 89.5% |
| Immigrants | Singapore | 100.0 /100 | #3 | Exceptional 89.3% |
| Iranians | 100.0 /100 | #4 | Exceptional 89.2% |
| Latvians | 100.0 /100 | #5 | Exceptional 89.2% |
| Thais | 100.0 /100 | #6 | Exceptional 89.1% |
| Eastern Europeans | 99.9 /100 | #7 | Exceptional 89.1% |
| Carpatho Rusyns | 99.9 /100 | #8 | Exceptional 89.1% |
| Chinese | 99.9 /100 | #9 | Exceptional 89.0% |
| Norwegians | 99.9 /100 | #10 | Exceptional 89.0% |
| Bulgarians | 99.9 /100 | #11 | Exceptional 89.0% |
| Lithuanians | 99.9 /100 | #12 | Exceptional 88.9% |
| Immigrants | Iran | 99.9 /100 | #13 | Exceptional 88.9% |
| Cypriots | 99.9 /100 | #14 | Exceptional 88.9% |
| Okinawans | 99.9 /100 | #15 | Exceptional 88.9% |
| Immigrants | Taiwan | 99.9 /100 | #16 | Exceptional 88.8% |
Demographics Similar to Immigrants from Eastern Europe by GED/Equivalency
In terms of ged/equivalency, the demographic groups most similar to Immigrants from Eastern Europe are Canadian (87.1%, a difference of 0.010%), Icelander (87.1%, a difference of 0.030%), Egyptian (87.1%, a difference of 0.030%), French (87.1%, a difference of 0.030%), and Immigrants from Zimbabwe (87.1%, a difference of 0.040%).
| Demographics | Rating | Rank | GED/Equivalency |
| Lebanese | 96.2 /100 | #102 | Exceptional 87.2% |
| Jordanians | 96.1 /100 | #103 | Exceptional 87.2% |
| Immigrants | Hungary | 96.0 /100 | #104 | Exceptional 87.2% |
| Indians (Asian) | 95.9 /100 | #105 | Exceptional 87.1% |
| Immigrants | Zimbabwe | 95.8 /100 | #106 | Exceptional 87.1% |
| Icelanders | 95.7 /100 | #107 | Exceptional 87.1% |
| Canadians | 95.6 /100 | #108 | Exceptional 87.1% |
| Immigrants | Eastern Europe | 95.5 /100 | #109 | Exceptional 87.1% |
| Egyptians | 95.3 /100 | #110 | Exceptional 87.1% |
| French | 95.2 /100 | #111 | Exceptional 87.1% |
| Tlingit-Haida | 94.8 /100 | #112 | Exceptional 87.0% |
| Assyrians/Chaldeans/Syriacs | 94.8 /100 | #113 | Exceptional 87.0% |
| Immigrants | Kazakhstan | 94.7 /100 | #114 | Exceptional 87.0% |
| Mongolians | 94.6 /100 | #115 | Exceptional 87.0% |
| Swiss | 94.5 /100 | #116 | Exceptional 87.0% |