Chinese vs Ghanaian Hearing Disability
COMPARE
Chinese
Ghanaian
Hearing Disability
Hearing Disability Comparison
Chinese
Ghanaians
3.7%
HEARING DISABILITY
0.0/ 100
METRIC RATING
289th/ 347
METRIC RANK
2.5%
HEARING DISABILITY
99.8/ 100
METRIC RATING
21st/ 347
METRIC RANK
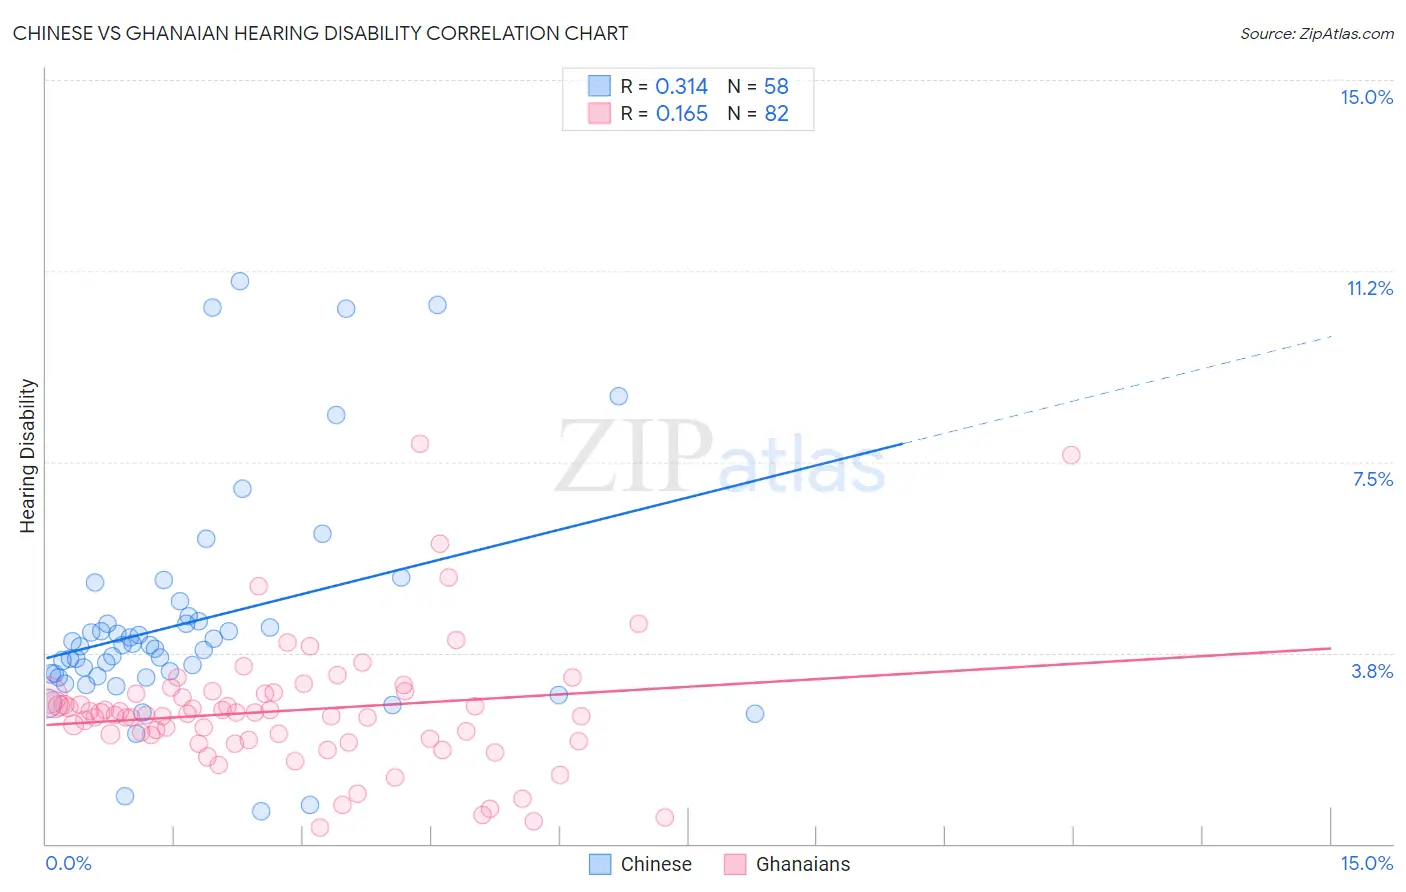
Chinese vs Ghanaian Hearing Disability Correlation Chart
The statistical analysis conducted on geographies consisting of 64,801,631 people shows a mild positive correlation between the proportion of Chinese and percentage of population with hearing disability in the United States with a correlation coefficient (R) of 0.314 and weighted average of 3.7%. Similarly, the statistical analysis conducted on geographies consisting of 190,612,767 people shows a poor positive correlation between the proportion of Ghanaians and percentage of population with hearing disability in the United States with a correlation coefficient (R) of 0.165 and weighted average of 2.5%, a difference of 44.3%.
Hearing Disability Correlation Summary
| Measurement | Chinese | Ghanaian |
| Minimum | 0.63% | 0.32% |
| Maximum | 11.0% | 7.9% |
| Range | 10.4% | 7.5% |
| Mean | 4.4% | 2.6% |
| Median | 3.9% | 2.5% |
| Interquartile 25% (IQ1) | 3.3% | 2.0% |
| Interquartile 75% (IQ3) | 4.4% | 3.0% |
| Interquartile Range (IQR) | 1.1% | 0.92% |
| Standard Deviation (Sample) | 2.2% | 1.3% |
| Standard Deviation (Population) | 2.2% | 1.3% |
Similar Demographics by Hearing Disability
Demographics Similar to Chinese by Hearing Disability
In terms of hearing disability, the demographic groups most similar to Chinese are White/Caucasian (3.7%, a difference of 0.13%), Finnish (3.7%, a difference of 0.15%), Irish (3.7%, a difference of 0.21%), Native Hawaiian (3.7%, a difference of 0.21%), and Norwegian (3.7%, a difference of 0.27%).
| Demographics | Rating | Rank | Hearing Disability |
| Swedes | 0.0 /100 | #282 | Tragic 3.6% |
| Blackfeet | 0.0 /100 | #283 | Tragic 3.6% |
| Immigrants | Micronesia | 0.0 /100 | #284 | Tragic 3.6% |
| Sioux | 0.0 /100 | #285 | Tragic 3.6% |
| Delaware | 0.0 /100 | #286 | Tragic 3.6% |
| Spanish | 0.0 /100 | #287 | Tragic 3.7% |
| Irish | 0.0 /100 | #288 | Tragic 3.7% |
| Chinese | 0.0 /100 | #289 | Tragic 3.7% |
| Whites/Caucasians | 0.0 /100 | #290 | Tragic 3.7% |
| Finns | 0.0 /100 | #291 | Tragic 3.7% |
| Native Hawaiians | 0.0 /100 | #292 | Tragic 3.7% |
| Norwegians | 0.0 /100 | #293 | Tragic 3.7% |
| Iroquois | 0.0 /100 | #294 | Tragic 3.7% |
| Welsh | 0.0 /100 | #295 | Tragic 3.7% |
| Pima | 0.0 /100 | #296 | Tragic 3.7% |
Demographics Similar to Ghanaians by Hearing Disability
In terms of hearing disability, the demographic groups most similar to Ghanaians are Immigrants from Sierra Leone (2.6%, a difference of 0.040%), Immigrants from Bolivia (2.5%, a difference of 0.070%), Thai (2.5%, a difference of 0.11%), Dominican (2.5%, a difference of 0.14%), and Immigrants from Nigeria (2.6%, a difference of 0.54%).
| Demographics | Rating | Rank | Hearing Disability |
| Ecuadorians | 99.9 /100 | #14 | Exceptional 2.5% |
| Barbadians | 99.9 /100 | #15 | Exceptional 2.5% |
| Immigrants | West Indies | 99.9 /100 | #16 | Exceptional 2.5% |
| Immigrants | India | 99.9 /100 | #17 | Exceptional 2.5% |
| Dominicans | 99.8 /100 | #18 | Exceptional 2.5% |
| Thais | 99.8 /100 | #19 | Exceptional 2.5% |
| Immigrants | Bolivia | 99.8 /100 | #20 | Exceptional 2.5% |
| Ghanaians | 99.8 /100 | #21 | Exceptional 2.5% |
| Immigrants | Sierra Leone | 99.8 /100 | #22 | Exceptional 2.6% |
| Immigrants | Nigeria | 99.8 /100 | #23 | Exceptional 2.6% |
| Immigrants | Ghana | 99.8 /100 | #24 | Exceptional 2.6% |
| Immigrants | El Salvador | 99.7 /100 | #25 | Exceptional 2.6% |
| Immigrants | Senegal | 99.7 /100 | #26 | Exceptional 2.6% |
| Immigrants | South Central Asia | 99.7 /100 | #27 | Exceptional 2.6% |
| Immigrants | Haiti | 99.7 /100 | #28 | Exceptional 2.6% |