Jamaican vs Immigrants from Eastern Europe Hearing Disability
COMPARE
Jamaican
Immigrants from Eastern Europe
Hearing Disability
Hearing Disability Comparison
Jamaicans
Immigrants from Eastern Europe
2.7%
HEARING DISABILITY
99.0/ 100
METRIC RATING
52nd/ 347
METRIC RANK
3.0%
HEARING DISABILITY
58.1/ 100
METRIC RATING
167th/ 347
METRIC RANK
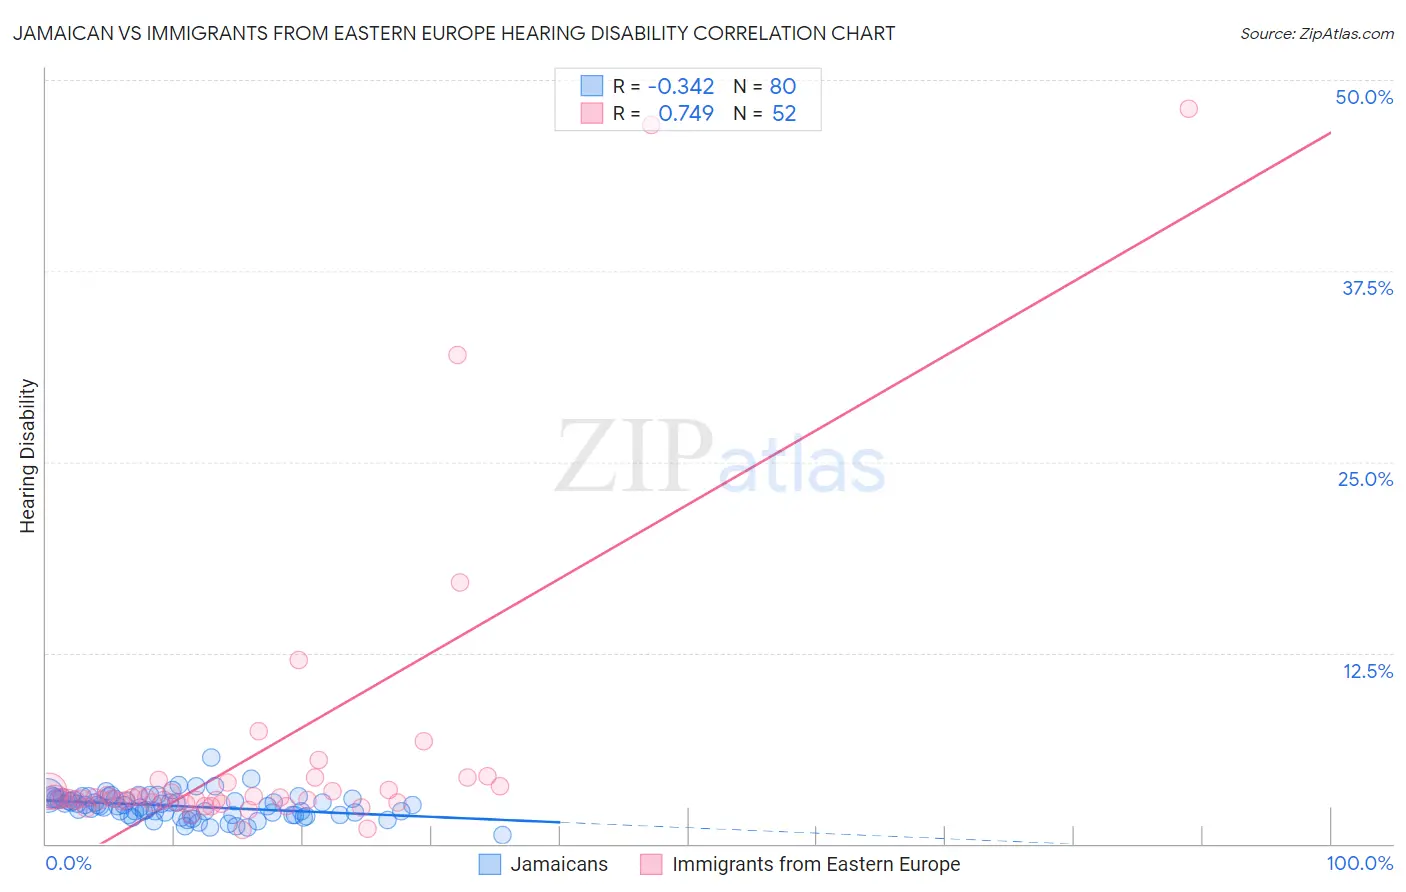
Jamaican vs Immigrants from Eastern Europe Hearing Disability Correlation Chart
The statistical analysis conducted on geographies consisting of 367,784,846 people shows a mild negative correlation between the proportion of Jamaicans and percentage of population with hearing disability in the United States with a correlation coefficient (R) of -0.342 and weighted average of 2.7%. Similarly, the statistical analysis conducted on geographies consisting of 475,611,830 people shows a strong positive correlation between the proportion of Immigrants from Eastern Europe and percentage of population with hearing disability in the United States with a correlation coefficient (R) of 0.749 and weighted average of 3.0%, a difference of 11.3%.
Hearing Disability Correlation Summary
| Measurement | Jamaican | Immigrants from Eastern Europe |
| Minimum | 0.58% | 0.94% |
| Maximum | 5.6% | 48.1% |
| Range | 5.0% | 47.2% |
| Mean | 2.5% | 5.9% |
| Median | 2.5% | 3.0% |
| Interquartile 25% (IQ1) | 1.9% | 2.7% |
| Interquartile 75% (IQ3) | 3.0% | 3.9% |
| Interquartile Range (IQR) | 1.1% | 1.2% |
| Standard Deviation (Sample) | 0.80% | 9.6% |
| Standard Deviation (Population) | 0.80% | 9.5% |
Similar Demographics by Hearing Disability
Demographics Similar to Jamaicans by Hearing Disability
In terms of hearing disability, the demographic groups most similar to Jamaicans are Immigrants from Eastern Asia (2.7%, a difference of 0.070%), Ethiopian (2.7%, a difference of 0.10%), Immigrants from Ethiopia (2.7%, a difference of 0.16%), Immigrants from Nicaragua (2.7%, a difference of 0.19%), and South American (2.7%, a difference of 0.23%).
| Demographics | Rating | Rank | Hearing Disability |
| Venezuelans | 99.4 /100 | #45 | Exceptional 2.6% |
| Immigrants | Dominica | 99.3 /100 | #46 | Exceptional 2.6% |
| Immigrants | Israel | 99.3 /100 | #47 | Exceptional 2.6% |
| Immigrants | Singapore | 99.3 /100 | #48 | Exceptional 2.6% |
| Immigrants | South America | 99.2 /100 | #49 | Exceptional 2.7% |
| Paraguayans | 99.2 /100 | #50 | Exceptional 2.7% |
| Immigrants | Hong Kong | 99.2 /100 | #51 | Exceptional 2.7% |
| Jamaicans | 99.0 /100 | #52 | Exceptional 2.7% |
| Immigrants | Eastern Asia | 99.0 /100 | #53 | Exceptional 2.7% |
| Ethiopians | 99.0 /100 | #54 | Exceptional 2.7% |
| Immigrants | Ethiopia | 99.0 /100 | #55 | Exceptional 2.7% |
| Immigrants | Nicaragua | 99.0 /100 | #56 | Exceptional 2.7% |
| South Americans | 99.0 /100 | #57 | Exceptional 2.7% |
| Immigrants | Peru | 98.6 /100 | #58 | Exceptional 2.7% |
| Immigrants | Eritrea | 98.5 /100 | #59 | Exceptional 2.7% |
Demographics Similar to Immigrants from Eastern Europe by Hearing Disability
In terms of hearing disability, the demographic groups most similar to Immigrants from Eastern Europe are Immigrants from Greece (3.0%, a difference of 0.020%), Arab (3.0%, a difference of 0.040%), Immigrants from Cabo Verde (3.0%, a difference of 0.11%), Immigrants from Ukraine (3.0%, a difference of 0.14%), and Armenian (3.0%, a difference of 0.20%).
| Demographics | Rating | Rank | Hearing Disability |
| Immigrants | Fiji | 67.1 /100 | #160 | Good 2.9% |
| Albanians | 66.6 /100 | #161 | Good 2.9% |
| Immigrants | Japan | 66.3 /100 | #162 | Good 2.9% |
| Immigrants | Central America | 64.9 /100 | #163 | Good 3.0% |
| Immigrants | Cambodia | 64.8 /100 | #164 | Good 3.0% |
| Immigrants | Zimbabwe | 64.2 /100 | #165 | Good 3.0% |
| Immigrants | South Eastern Asia | 62.9 /100 | #166 | Good 3.0% |
| Immigrants | Eastern Europe | 58.1 /100 | #167 | Average 3.0% |
| Immigrants | Greece | 57.9 /100 | #168 | Average 3.0% |
| Arabs | 57.6 /100 | #169 | Average 3.0% |
| Immigrants | Cabo Verde | 56.9 /100 | #170 | Average 3.0% |
| Immigrants | Ukraine | 56.6 /100 | #171 | Average 3.0% |
| Armenians | 56.0 /100 | #172 | Average 3.0% |
| Immigrants | Serbia | 51.1 /100 | #173 | Average 3.0% |
| Indonesians | 50.0 /100 | #174 | Average 3.0% |