Mongolian vs Immigrants from Eastern Europe Hearing Disability
COMPARE
Mongolian
Immigrants from Eastern Europe
Hearing Disability
Hearing Disability Comparison
Mongolians
Immigrants from Eastern Europe
2.7%
HEARING DISABILITY
97.4/ 100
METRIC RATING
78th/ 347
METRIC RANK
3.0%
HEARING DISABILITY
58.1/ 100
METRIC RATING
167th/ 347
METRIC RANK
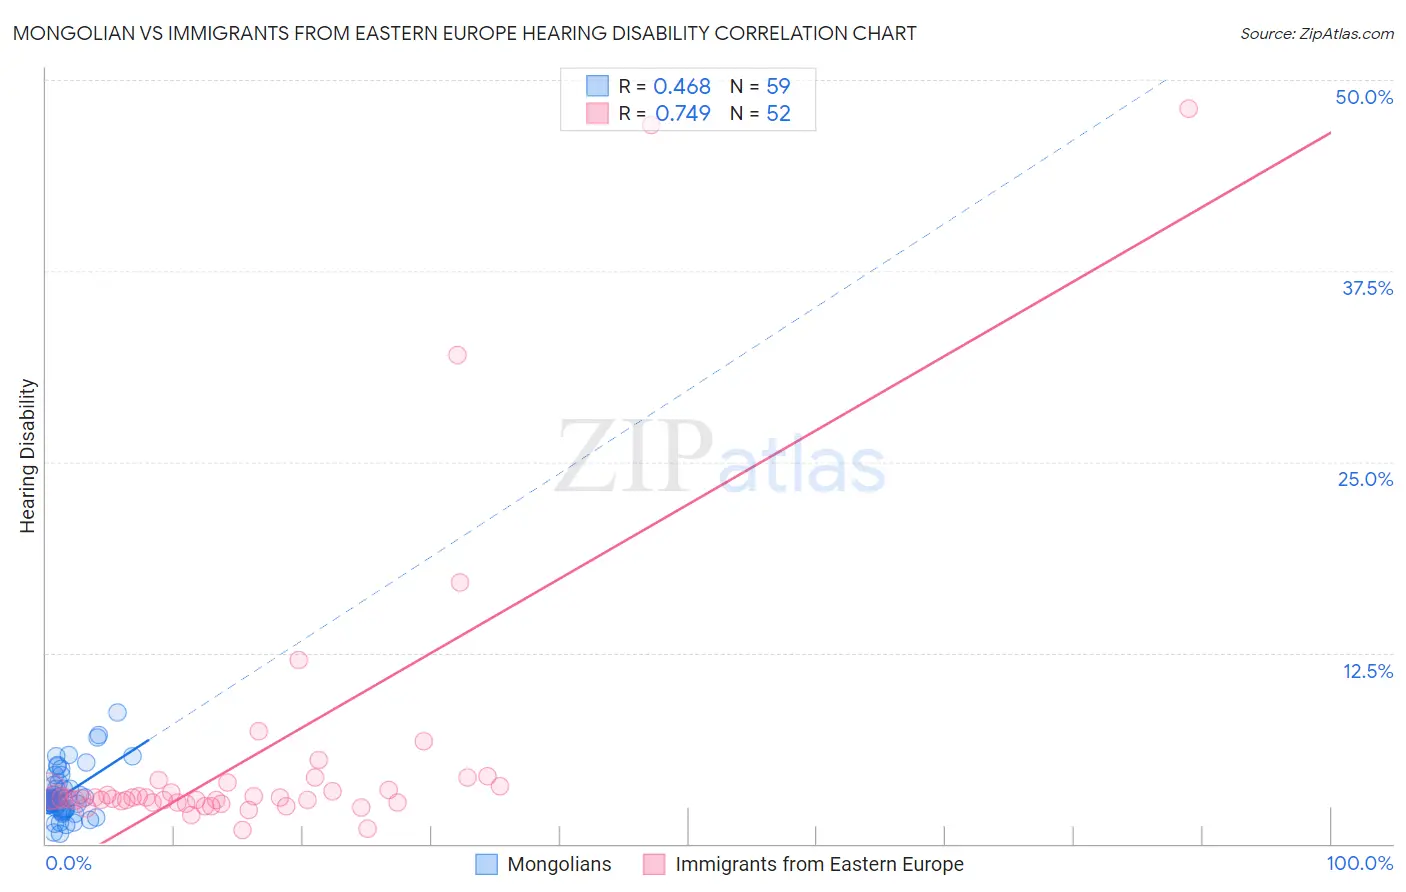
Mongolian vs Immigrants from Eastern Europe Hearing Disability Correlation Chart
The statistical analysis conducted on geographies consisting of 140,352,505 people shows a moderate positive correlation between the proportion of Mongolians and percentage of population with hearing disability in the United States with a correlation coefficient (R) of 0.468 and weighted average of 2.7%. Similarly, the statistical analysis conducted on geographies consisting of 475,611,830 people shows a strong positive correlation between the proportion of Immigrants from Eastern Europe and percentage of population with hearing disability in the United States with a correlation coefficient (R) of 0.749 and weighted average of 3.0%, a difference of 8.5%.
Hearing Disability Correlation Summary
| Measurement | Mongolian | Immigrants from Eastern Europe |
| Minimum | 0.63% | 0.94% |
| Maximum | 8.6% | 48.1% |
| Range | 8.0% | 47.2% |
| Mean | 3.2% | 5.9% |
| Median | 2.8% | 3.0% |
| Interquartile 25% (IQ1) | 2.3% | 2.7% |
| Interquartile 75% (IQ3) | 3.6% | 3.9% |
| Interquartile Range (IQR) | 1.4% | 1.2% |
| Standard Deviation (Sample) | 1.6% | 9.6% |
| Standard Deviation (Population) | 1.6% | 9.5% |
Similar Demographics by Hearing Disability
Demographics Similar to Mongolians by Hearing Disability
In terms of hearing disability, the demographic groups most similar to Mongolians are Colombian (2.7%, a difference of 0.020%), Immigrants from Malaysia (2.7%, a difference of 0.040%), Immigrants from Saudi Arabia (2.7%, a difference of 0.070%), Asian (2.7%, a difference of 0.070%), and Immigrants from Korea (2.7%, a difference of 0.090%).
| Demographics | Rating | Rank | Hearing Disability |
| Central Americans | 97.7 /100 | #71 | Exceptional 2.7% |
| Afghans | 97.6 /100 | #72 | Exceptional 2.7% |
| Argentineans | 97.5 /100 | #73 | Exceptional 2.7% |
| Immigrants | Korea | 97.5 /100 | #74 | Exceptional 2.7% |
| Immigrants | Saudi Arabia | 97.5 /100 | #75 | Exceptional 2.7% |
| Asians | 97.5 /100 | #76 | Exceptional 2.7% |
| Immigrants | Malaysia | 97.5 /100 | #77 | Exceptional 2.7% |
| Mongolians | 97.4 /100 | #78 | Exceptional 2.7% |
| Colombians | 97.4 /100 | #79 | Exceptional 2.7% |
| Immigrants | Asia | 97.2 /100 | #80 | Exceptional 2.7% |
| Immigrants | Uruguay | 97.2 /100 | #81 | Exceptional 2.7% |
| Immigrants | Armenia | 97.2 /100 | #82 | Exceptional 2.7% |
| Immigrants | Cuba | 97.2 /100 | #83 | Exceptional 2.7% |
| Immigrants | Argentina | 97.0 /100 | #84 | Exceptional 2.8% |
| Immigrants | Northern Africa | 96.9 /100 | #85 | Exceptional 2.8% |
Demographics Similar to Immigrants from Eastern Europe by Hearing Disability
In terms of hearing disability, the demographic groups most similar to Immigrants from Eastern Europe are Immigrants from Greece (3.0%, a difference of 0.020%), Arab (3.0%, a difference of 0.040%), Immigrants from Cabo Verde (3.0%, a difference of 0.11%), Immigrants from Ukraine (3.0%, a difference of 0.14%), and Armenian (3.0%, a difference of 0.20%).
| Demographics | Rating | Rank | Hearing Disability |
| Immigrants | Fiji | 67.1 /100 | #160 | Good 2.9% |
| Albanians | 66.6 /100 | #161 | Good 2.9% |
| Immigrants | Japan | 66.3 /100 | #162 | Good 2.9% |
| Immigrants | Central America | 64.9 /100 | #163 | Good 3.0% |
| Immigrants | Cambodia | 64.8 /100 | #164 | Good 3.0% |
| Immigrants | Zimbabwe | 64.2 /100 | #165 | Good 3.0% |
| Immigrants | South Eastern Asia | 62.9 /100 | #166 | Good 3.0% |
| Immigrants | Eastern Europe | 58.1 /100 | #167 | Average 3.0% |
| Immigrants | Greece | 57.9 /100 | #168 | Average 3.0% |
| Arabs | 57.6 /100 | #169 | Average 3.0% |
| Immigrants | Cabo Verde | 56.9 /100 | #170 | Average 3.0% |
| Immigrants | Ukraine | 56.6 /100 | #171 | Average 3.0% |
| Armenians | 56.0 /100 | #172 | Average 3.0% |
| Immigrants | Serbia | 51.1 /100 | #173 | Average 3.0% |
| Indonesians | 50.0 /100 | #174 | Average 3.0% |