Chickasaw vs Immigrants from Sudan Cognitive Disability
COMPARE
Chickasaw
Immigrants from Sudan
Cognitive Disability
Cognitive Disability Comparison
Chickasaw
Immigrants from Sudan
18.5%
COGNITIVE DISABILITY
0.0/ 100
METRIC RATING
312th/ 347
METRIC RANK
18.8%
COGNITIVE DISABILITY
0.0/ 100
METRIC RATING
332nd/ 347
METRIC RANK
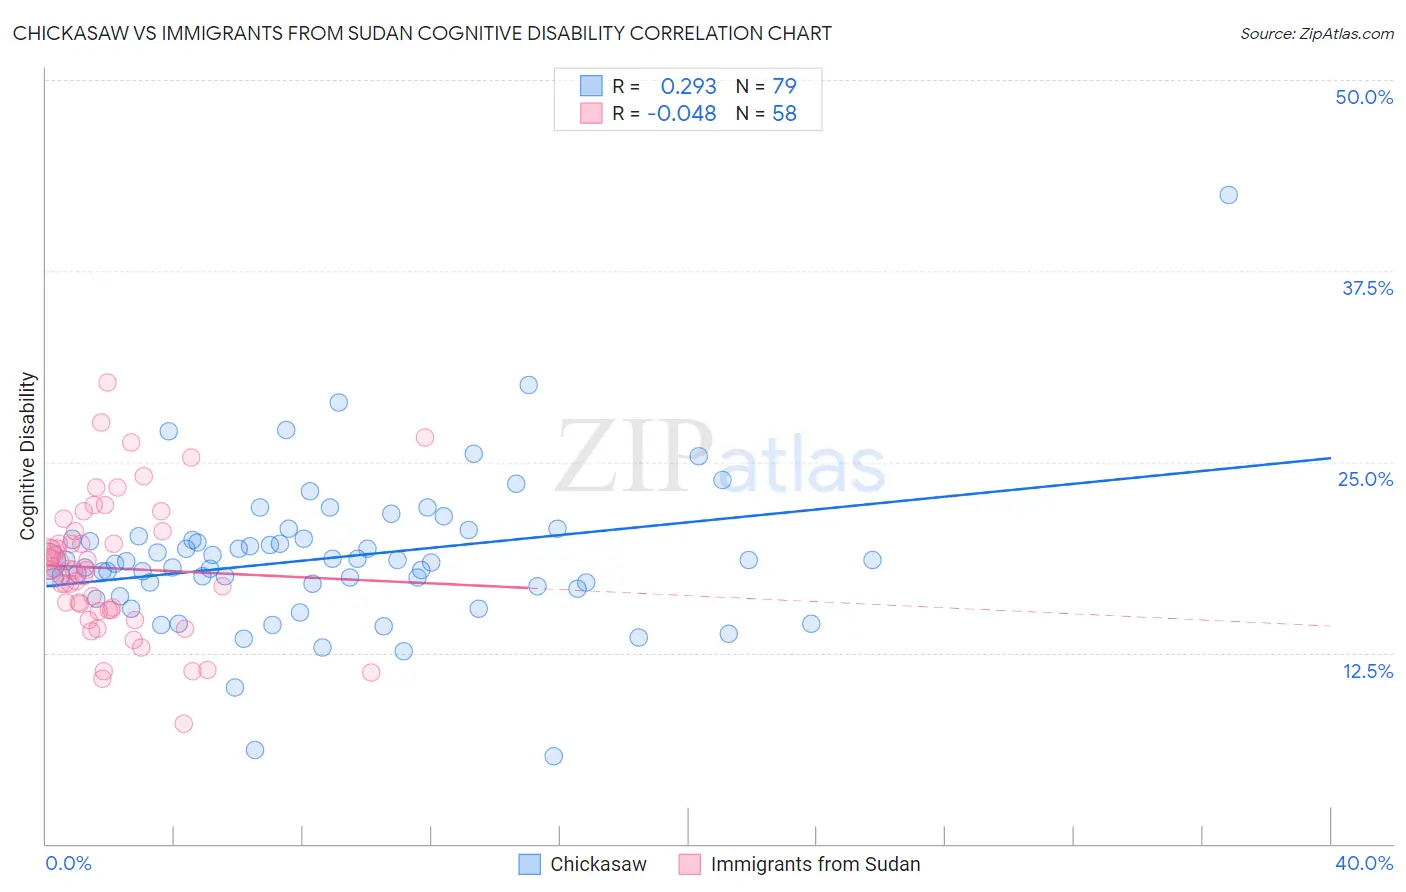
Chickasaw vs Immigrants from Sudan Cognitive Disability Correlation Chart
The statistical analysis conducted on geographies consisting of 147,689,565 people shows a weak positive correlation between the proportion of Chickasaw and percentage of population with cognitive disability in the United States with a correlation coefficient (R) of 0.293 and weighted average of 18.5%. Similarly, the statistical analysis conducted on geographies consisting of 118,956,545 people shows no correlation between the proportion of Immigrants from Sudan and percentage of population with cognitive disability in the United States with a correlation coefficient (R) of -0.048 and weighted average of 18.8%, a difference of 1.6%.
Cognitive Disability Correlation Summary
| Measurement | Chickasaw | Immigrants from Sudan |
| Minimum | 5.7% | 7.8% |
| Maximum | 42.5% | 30.2% |
| Range | 36.8% | 22.4% |
| Mean | 18.7% | 18.0% |
| Median | 18.5% | 17.9% |
| Interquartile 25% (IQ1) | 16.9% | 15.3% |
| Interquartile 75% (IQ3) | 20.0% | 20.4% |
| Interquartile Range (IQR) | 3.1% | 5.1% |
| Standard Deviation (Sample) | 4.9% | 4.5% |
| Standard Deviation (Population) | 4.9% | 4.4% |
Demographics Similar to Chickasaw and Immigrants from Sudan by Cognitive Disability
In terms of cognitive disability, the demographic groups most similar to Chickasaw are Yaqui (18.5%, a difference of 0.11%), Subsaharan African (18.5%, a difference of 0.17%), Immigrants from Dominica (18.6%, a difference of 0.35%), Immigrants from Middle Africa (18.6%, a difference of 0.43%), and Liberian (18.6%, a difference of 0.51%). Similarly, the demographic groups most similar to Immigrants from Sudan are Pima (18.8%, a difference of 0.020%), Immigrants from Dominican Republic (18.8%, a difference of 0.080%), Navajo (18.8%, a difference of 0.18%), Kiowa (18.7%, a difference of 0.40%), and U.S. Virgin Islander (18.7%, a difference of 0.46%).
| Demographics | Rating | Rank | Cognitive Disability |
| Chickasaw | 0.0 /100 | #312 | Tragic 18.5% |
| Yaqui | 0.0 /100 | #313 | Tragic 18.5% |
| Sub-Saharan Africans | 0.0 /100 | #314 | Tragic 18.5% |
| Immigrants | Dominica | 0.0 /100 | #315 | Tragic 18.6% |
| Immigrants | Middle Africa | 0.0 /100 | #316 | Tragic 18.6% |
| Liberians | 0.0 /100 | #317 | Tragic 18.6% |
| Bangladeshis | 0.0 /100 | #318 | Tragic 18.6% |
| Comanche | 0.0 /100 | #319 | Tragic 18.6% |
| Apache | 0.0 /100 | #320 | Tragic 18.6% |
| Africans | 0.0 /100 | #321 | Tragic 18.6% |
| Immigrants | Liberia | 0.0 /100 | #322 | Tragic 18.7% |
| Pueblo | 0.0 /100 | #323 | Tragic 18.7% |
| Dominicans | 0.0 /100 | #324 | Tragic 18.7% |
| Indonesians | 0.0 /100 | #325 | Tragic 18.7% |
| Immigrants | Senegal | 0.0 /100 | #326 | Tragic 18.7% |
| U.S. Virgin Islanders | 0.0 /100 | #327 | Tragic 18.7% |
| Kiowa | 0.0 /100 | #328 | Tragic 18.7% |
| Navajo | 0.0 /100 | #329 | Tragic 18.8% |
| Immigrants | Dominican Republic | 0.0 /100 | #330 | Tragic 18.8% |
| Pima | 0.0 /100 | #331 | Tragic 18.8% |
| Immigrants | Sudan | 0.0 /100 | #332 | Tragic 18.8% |