Greek vs Hispanic or Latino Cognitive Disability
COMPARE
Greek
Hispanic or Latino
Cognitive Disability
Cognitive Disability Comparison
Greeks
Hispanics or Latinos
16.4%
COGNITIVE DISABILITY
99.9/ 100
METRIC RATING
36th/ 347
METRIC RANK
17.9%
COGNITIVE DISABILITY
0.6/ 100
METRIC RATING
254th/ 347
METRIC RANK
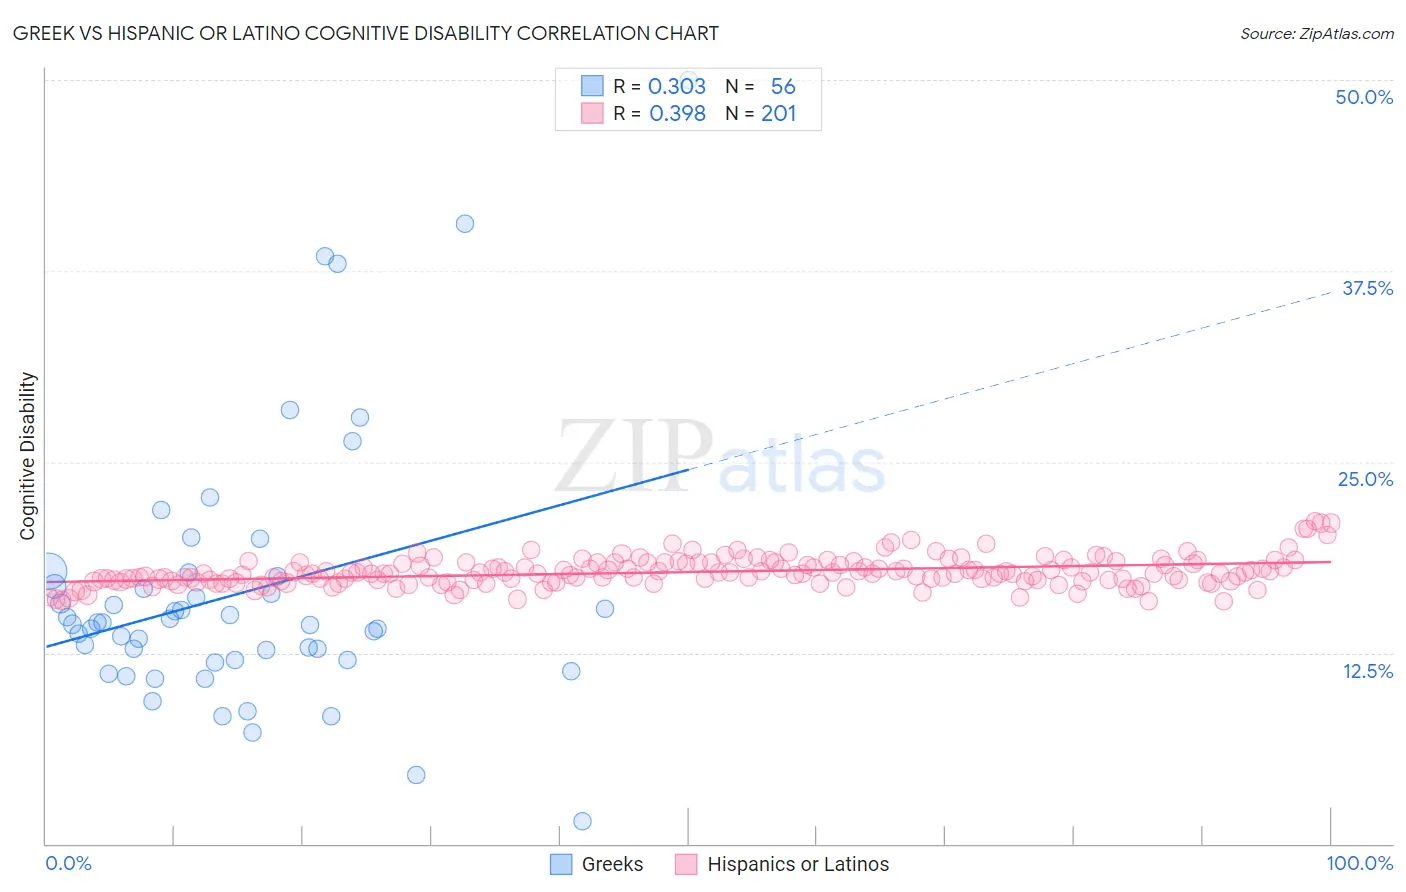
Greek vs Hispanic or Latino Cognitive Disability Correlation Chart
The statistical analysis conducted on geographies consisting of 482,712,046 people shows a mild positive correlation between the proportion of Greeks and percentage of population with cognitive disability in the United States with a correlation coefficient (R) of 0.303 and weighted average of 16.4%. Similarly, the statistical analysis conducted on geographies consisting of 578,401,671 people shows a mild positive correlation between the proportion of Hispanics or Latinos and percentage of population with cognitive disability in the United States with a correlation coefficient (R) of 0.398 and weighted average of 17.9%, a difference of 9.0%.
Cognitive Disability Correlation Summary
| Measurement | Greek | Hispanic or Latino |
| Minimum | 1.5% | 15.8% |
| Maximum | 50.0% | 21.1% |
| Range | 48.5% | 5.3% |
| Mean | 16.4% | 17.8% |
| Median | 14.4% | 17.7% |
| Interquartile 25% (IQ1) | 12.0% | 17.2% |
| Interquartile 75% (IQ3) | 17.2% | 18.4% |
| Interquartile Range (IQR) | 5.2% | 1.2% |
| Standard Deviation (Sample) | 8.7% | 0.96% |
| Standard Deviation (Population) | 8.6% | 0.96% |
Similar Demographics by Cognitive Disability
Demographics Similar to Greeks by Cognitive Disability
In terms of cognitive disability, the demographic groups most similar to Greeks are Slovak (16.4%, a difference of 0.010%), Italian (16.4%, a difference of 0.090%), Russian (16.4%, a difference of 0.090%), Slovene (16.5%, a difference of 0.15%), and Immigrants from Israel (16.4%, a difference of 0.16%).
| Demographics | Rating | Rank | Cognitive Disability |
| Filipinos | 99.9 /100 | #29 | Exceptional 16.4% |
| Czechs | 99.9 /100 | #30 | Exceptional 16.4% |
| Immigrants | Romania | 99.9 /100 | #31 | Exceptional 16.4% |
| Immigrants | Israel | 99.9 /100 | #32 | Exceptional 16.4% |
| Italians | 99.9 /100 | #33 | Exceptional 16.4% |
| Russians | 99.9 /100 | #34 | Exceptional 16.4% |
| Slovaks | 99.9 /100 | #35 | Exceptional 16.4% |
| Greeks | 99.9 /100 | #36 | Exceptional 16.4% |
| Slovenes | 99.9 /100 | #37 | Exceptional 16.5% |
| Immigrants | Eastern Europe | 99.9 /100 | #38 | Exceptional 16.5% |
| Bolivians | 99.9 /100 | #39 | Exceptional 16.5% |
| Immigrants | Belarus | 99.9 /100 | #40 | Exceptional 16.5% |
| Cubans | 99.9 /100 | #41 | Exceptional 16.5% |
| Hungarians | 99.9 /100 | #42 | Exceptional 16.5% |
| Immigrants | Canada | 99.8 /100 | #43 | Exceptional 16.5% |
Demographics Similar to Hispanics or Latinos by Cognitive Disability
In terms of cognitive disability, the demographic groups most similar to Hispanics or Latinos are Hopi (17.9%, a difference of 0.0%), Immigrants from the Azores (17.9%, a difference of 0.0%), Bahamian (17.9%, a difference of 0.010%), Immigrants from Grenada (17.9%, a difference of 0.020%), and Cree (17.9%, a difference of 0.030%).
| Demographics | Rating | Rank | Cognitive Disability |
| Samoans | 0.7 /100 | #247 | Tragic 17.9% |
| French American Indians | 0.7 /100 | #248 | Tragic 17.9% |
| Cree | 0.7 /100 | #249 | Tragic 17.9% |
| Immigrants | Ethiopia | 0.7 /100 | #250 | Tragic 17.9% |
| Malaysians | 0.6 /100 | #251 | Tragic 17.9% |
| Immigrants | Grenada | 0.6 /100 | #252 | Tragic 17.9% |
| Hopi | 0.6 /100 | #253 | Tragic 17.9% |
| Hispanics or Latinos | 0.6 /100 | #254 | Tragic 17.9% |
| Immigrants | Azores | 0.6 /100 | #255 | Tragic 17.9% |
| Bahamians | 0.6 /100 | #256 | Tragic 17.9% |
| Mexican American Indians | 0.6 /100 | #257 | Tragic 17.9% |
| Immigrants | Armenia | 0.6 /100 | #258 | Tragic 17.9% |
| Ethiopians | 0.5 /100 | #259 | Tragic 17.9% |
| Immigrants | Belize | 0.5 /100 | #260 | Tragic 17.9% |
| Guamanians/Chamorros | 0.5 /100 | #261 | Tragic 17.9% |