Latvian vs Hispanic or Latino Cognitive Disability
COMPARE
Latvian
Hispanic or Latino
Cognitive Disability
Cognitive Disability Comparison
Latvians
Hispanics or Latinos
16.6%
COGNITIVE DISABILITY
99.5/ 100
METRIC RATING
67th/ 347
METRIC RANK
17.9%
COGNITIVE DISABILITY
0.6/ 100
METRIC RATING
254th/ 347
METRIC RANK
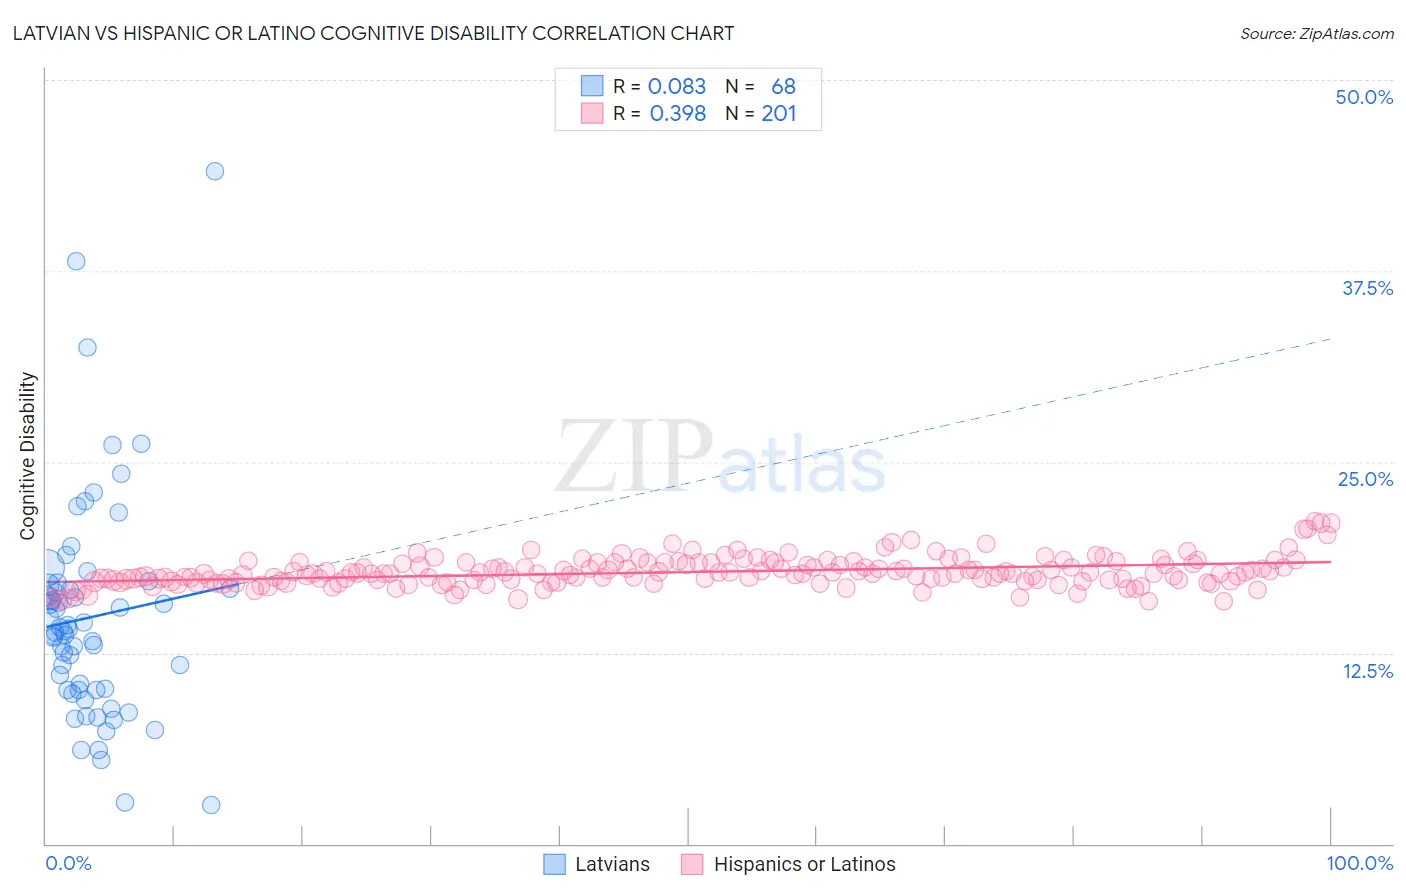
Latvian vs Hispanic or Latino Cognitive Disability Correlation Chart
The statistical analysis conducted on geographies consisting of 220,719,023 people shows a slight positive correlation between the proportion of Latvians and percentage of population with cognitive disability in the United States with a correlation coefficient (R) of 0.083 and weighted average of 16.6%. Similarly, the statistical analysis conducted on geographies consisting of 578,401,671 people shows a mild positive correlation between the proportion of Hispanics or Latinos and percentage of population with cognitive disability in the United States with a correlation coefficient (R) of 0.398 and weighted average of 17.9%, a difference of 7.6%.
Cognitive Disability Correlation Summary
| Measurement | Latvian | Hispanic or Latino |
| Minimum | 2.6% | 15.8% |
| Maximum | 44.0% | 21.1% |
| Range | 41.5% | 5.3% |
| Mean | 14.8% | 17.8% |
| Median | 14.0% | 17.7% |
| Interquartile 25% (IQ1) | 10.1% | 17.2% |
| Interquartile 75% (IQ3) | 16.8% | 18.4% |
| Interquartile Range (IQR) | 6.7% | 1.2% |
| Standard Deviation (Sample) | 7.2% | 0.96% |
| Standard Deviation (Population) | 7.2% | 0.96% |
Similar Demographics by Cognitive Disability
Demographics Similar to Latvians by Cognitive Disability
In terms of cognitive disability, the demographic groups most similar to Latvians are Immigrants from Ukraine (16.6%, a difference of 0.040%), Ukrainian (16.6%, a difference of 0.040%), Immigrants from Uzbekistan (16.7%, a difference of 0.12%), Immigrants from Sweden (16.7%, a difference of 0.13%), and Immigrants from Belgium (16.7%, a difference of 0.14%).
| Demographics | Rating | Rank | Cognitive Disability |
| Romanians | 99.7 /100 | #60 | Exceptional 16.6% |
| Immigrants | England | 99.6 /100 | #61 | Exceptional 16.6% |
| Czechoslovakians | 99.6 /100 | #62 | Exceptional 16.6% |
| Argentineans | 99.6 /100 | #63 | Exceptional 16.6% |
| Venezuelans | 99.6 /100 | #64 | Exceptional 16.6% |
| Colombians | 99.6 /100 | #65 | Exceptional 16.6% |
| Immigrants | Ukraine | 99.5 /100 | #66 | Exceptional 16.6% |
| Latvians | 99.5 /100 | #67 | Exceptional 16.6% |
| Ukrainians | 99.4 /100 | #68 | Exceptional 16.6% |
| Immigrants | Uzbekistan | 99.4 /100 | #69 | Exceptional 16.7% |
| Immigrants | Sweden | 99.4 /100 | #70 | Exceptional 16.7% |
| Immigrants | Belgium | 99.3 /100 | #71 | Exceptional 16.7% |
| Germans | 99.3 /100 | #72 | Exceptional 16.7% |
| Burmese | 99.3 /100 | #73 | Exceptional 16.7% |
| Slavs | 99.3 /100 | #74 | Exceptional 16.7% |
Demographics Similar to Hispanics or Latinos by Cognitive Disability
In terms of cognitive disability, the demographic groups most similar to Hispanics or Latinos are Hopi (17.9%, a difference of 0.0%), Immigrants from the Azores (17.9%, a difference of 0.0%), Bahamian (17.9%, a difference of 0.010%), Immigrants from Grenada (17.9%, a difference of 0.020%), and Cree (17.9%, a difference of 0.030%).
| Demographics | Rating | Rank | Cognitive Disability |
| Samoans | 0.7 /100 | #247 | Tragic 17.9% |
| French American Indians | 0.7 /100 | #248 | Tragic 17.9% |
| Cree | 0.7 /100 | #249 | Tragic 17.9% |
| Immigrants | Ethiopia | 0.7 /100 | #250 | Tragic 17.9% |
| Malaysians | 0.6 /100 | #251 | Tragic 17.9% |
| Immigrants | Grenada | 0.6 /100 | #252 | Tragic 17.9% |
| Hopi | 0.6 /100 | #253 | Tragic 17.9% |
| Hispanics or Latinos | 0.6 /100 | #254 | Tragic 17.9% |
| Immigrants | Azores | 0.6 /100 | #255 | Tragic 17.9% |
| Bahamians | 0.6 /100 | #256 | Tragic 17.9% |
| Mexican American Indians | 0.6 /100 | #257 | Tragic 17.9% |
| Immigrants | Armenia | 0.6 /100 | #258 | Tragic 17.9% |
| Ethiopians | 0.5 /100 | #259 | Tragic 17.9% |
| Immigrants | Belize | 0.5 /100 | #260 | Tragic 17.9% |
| Guamanians/Chamorros | 0.5 /100 | #261 | Tragic 17.9% |