Immigrants from Morocco vs Hispanic or Latino Cognitive Disability
COMPARE
Immigrants from Morocco
Hispanic or Latino
Cognitive Disability
Cognitive Disability Comparison
Immigrants from Morocco
Hispanics or Latinos
17.5%
COGNITIVE DISABILITY
12.0/ 100
METRIC RATING
202nd/ 347
METRIC RANK
17.9%
COGNITIVE DISABILITY
0.6/ 100
METRIC RATING
254th/ 347
METRIC RANK
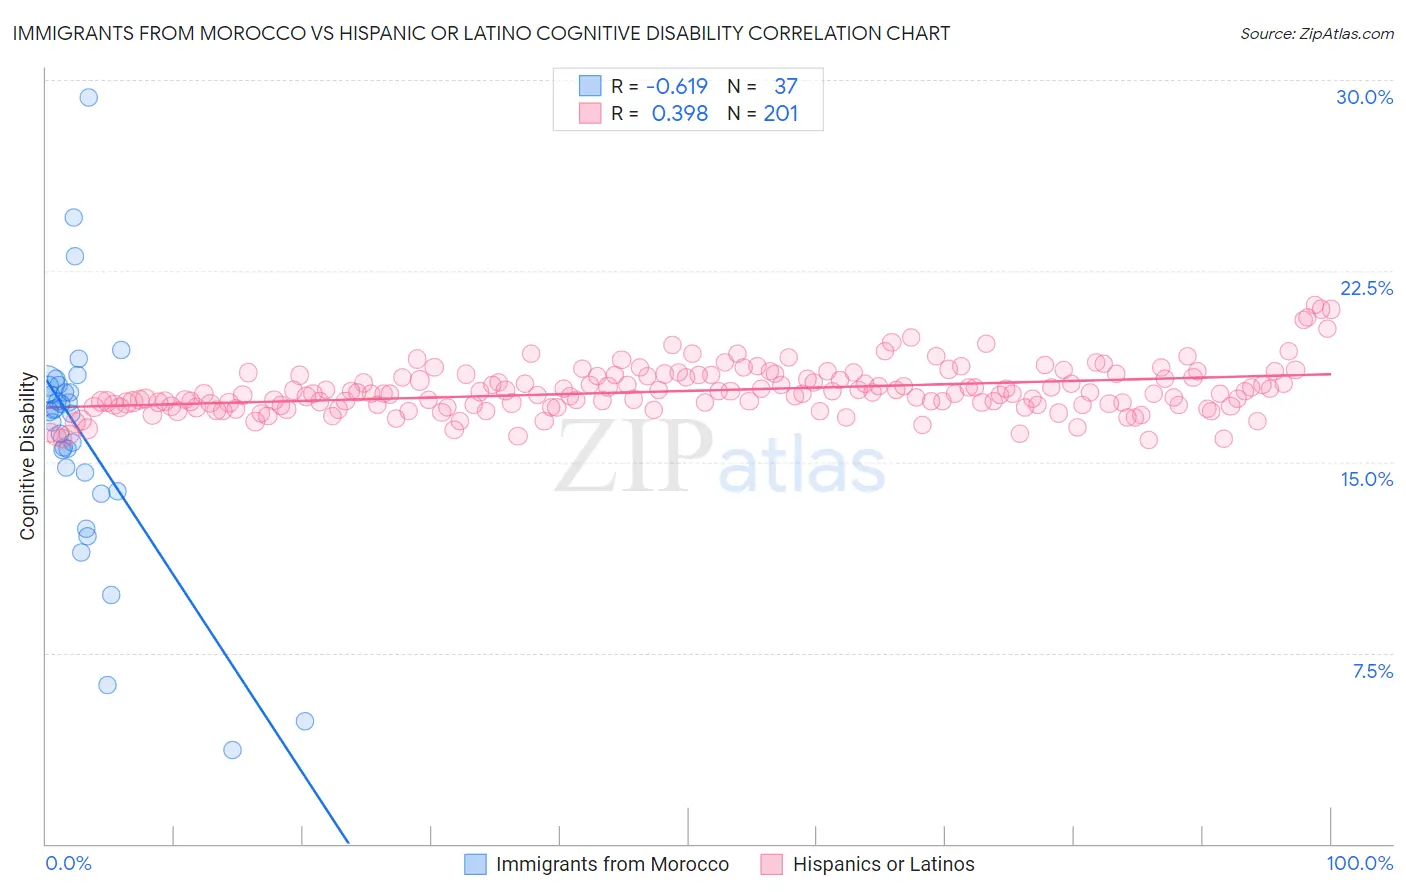
Immigrants from Morocco vs Hispanic or Latino Cognitive Disability Correlation Chart
The statistical analysis conducted on geographies consisting of 178,912,345 people shows a significant negative correlation between the proportion of Immigrants from Morocco and percentage of population with cognitive disability in the United States with a correlation coefficient (R) of -0.619 and weighted average of 17.5%. Similarly, the statistical analysis conducted on geographies consisting of 578,401,671 people shows a mild positive correlation between the proportion of Hispanics or Latinos and percentage of population with cognitive disability in the United States with a correlation coefficient (R) of 0.398 and weighted average of 17.9%, a difference of 2.2%.
Cognitive Disability Correlation Summary
| Measurement | Immigrants from Morocco | Hispanic or Latino |
| Minimum | 3.7% | 15.8% |
| Maximum | 29.3% | 21.1% |
| Range | 25.6% | 5.3% |
| Mean | 16.0% | 17.8% |
| Median | 17.0% | 17.7% |
| Interquartile 25% (IQ1) | 14.2% | 17.2% |
| Interquartile 75% (IQ3) | 18.0% | 18.4% |
| Interquartile Range (IQR) | 3.8% | 1.2% |
| Standard Deviation (Sample) | 4.8% | 0.96% |
| Standard Deviation (Population) | 4.8% | 0.96% |
Similar Demographics by Cognitive Disability
Demographics Similar to Immigrants from Morocco by Cognitive Disability
In terms of cognitive disability, the demographic groups most similar to Immigrants from Morocco are South American Indian (17.5%, a difference of 0.060%), Immigrants from Caribbean (17.5%, a difference of 0.070%), Immigrants from Zimbabwe (17.5%, a difference of 0.070%), Puget Sound Salish (17.5%, a difference of 0.080%), and Alaska Native (17.5%, a difference of 0.12%).
| Demographics | Rating | Rank | Cognitive Disability |
| New Zealanders | 21.1 /100 | #195 | Fair 17.4% |
| Guyanese | 17.5 /100 | #196 | Poor 17.5% |
| Immigrants | Afghanistan | 16.7 /100 | #197 | Poor 17.5% |
| Immigrants | Panama | 14.8 /100 | #198 | Poor 17.5% |
| Immigrants | Singapore | 14.3 /100 | #199 | Poor 17.5% |
| Haitians | 14.1 /100 | #200 | Poor 17.5% |
| South American Indians | 13.0 /100 | #201 | Poor 17.5% |
| Immigrants | Morocco | 12.0 /100 | #202 | Poor 17.5% |
| Immigrants | Caribbean | 11.0 /100 | #203 | Poor 17.5% |
| Immigrants | Zimbabwe | 11.0 /100 | #204 | Poor 17.5% |
| Puget Sound Salish | 10.9 /100 | #205 | Poor 17.5% |
| Alaska Natives | 10.4 /100 | #206 | Poor 17.5% |
| Immigrants | Latin America | 9.7 /100 | #207 | Tragic 17.6% |
| Immigrants | Cameroon | 9.3 /100 | #208 | Tragic 17.6% |
| Immigrants | Trinidad and Tobago | 8.7 /100 | #209 | Tragic 17.6% |
Demographics Similar to Hispanics or Latinos by Cognitive Disability
In terms of cognitive disability, the demographic groups most similar to Hispanics or Latinos are Hopi (17.9%, a difference of 0.0%), Immigrants from the Azores (17.9%, a difference of 0.0%), Bahamian (17.9%, a difference of 0.010%), Immigrants from Grenada (17.9%, a difference of 0.020%), and Cree (17.9%, a difference of 0.030%).
| Demographics | Rating | Rank | Cognitive Disability |
| Samoans | 0.7 /100 | #247 | Tragic 17.9% |
| French American Indians | 0.7 /100 | #248 | Tragic 17.9% |
| Cree | 0.7 /100 | #249 | Tragic 17.9% |
| Immigrants | Ethiopia | 0.7 /100 | #250 | Tragic 17.9% |
| Malaysians | 0.6 /100 | #251 | Tragic 17.9% |
| Immigrants | Grenada | 0.6 /100 | #252 | Tragic 17.9% |
| Hopi | 0.6 /100 | #253 | Tragic 17.9% |
| Hispanics or Latinos | 0.6 /100 | #254 | Tragic 17.9% |
| Immigrants | Azores | 0.6 /100 | #255 | Tragic 17.9% |
| Bahamians | 0.6 /100 | #256 | Tragic 17.9% |
| Mexican American Indians | 0.6 /100 | #257 | Tragic 17.9% |
| Immigrants | Armenia | 0.6 /100 | #258 | Tragic 17.9% |
| Ethiopians | 0.5 /100 | #259 | Tragic 17.9% |
| Immigrants | Belize | 0.5 /100 | #260 | Tragic 17.9% |
| Guamanians/Chamorros | 0.5 /100 | #261 | Tragic 17.9% |