Carpatho Rusyn vs Hispanic or Latino Cognitive Disability
COMPARE
Carpatho Rusyn
Hispanic or Latino
Cognitive Disability
Cognitive Disability Comparison
Carpatho Rusyns
Hispanics or Latinos
17.0%
COGNITIVE DISABILITY
89.6/ 100
METRIC RATING
142nd/ 347
METRIC RANK
17.9%
COGNITIVE DISABILITY
0.6/ 100
METRIC RATING
254th/ 347
METRIC RANK
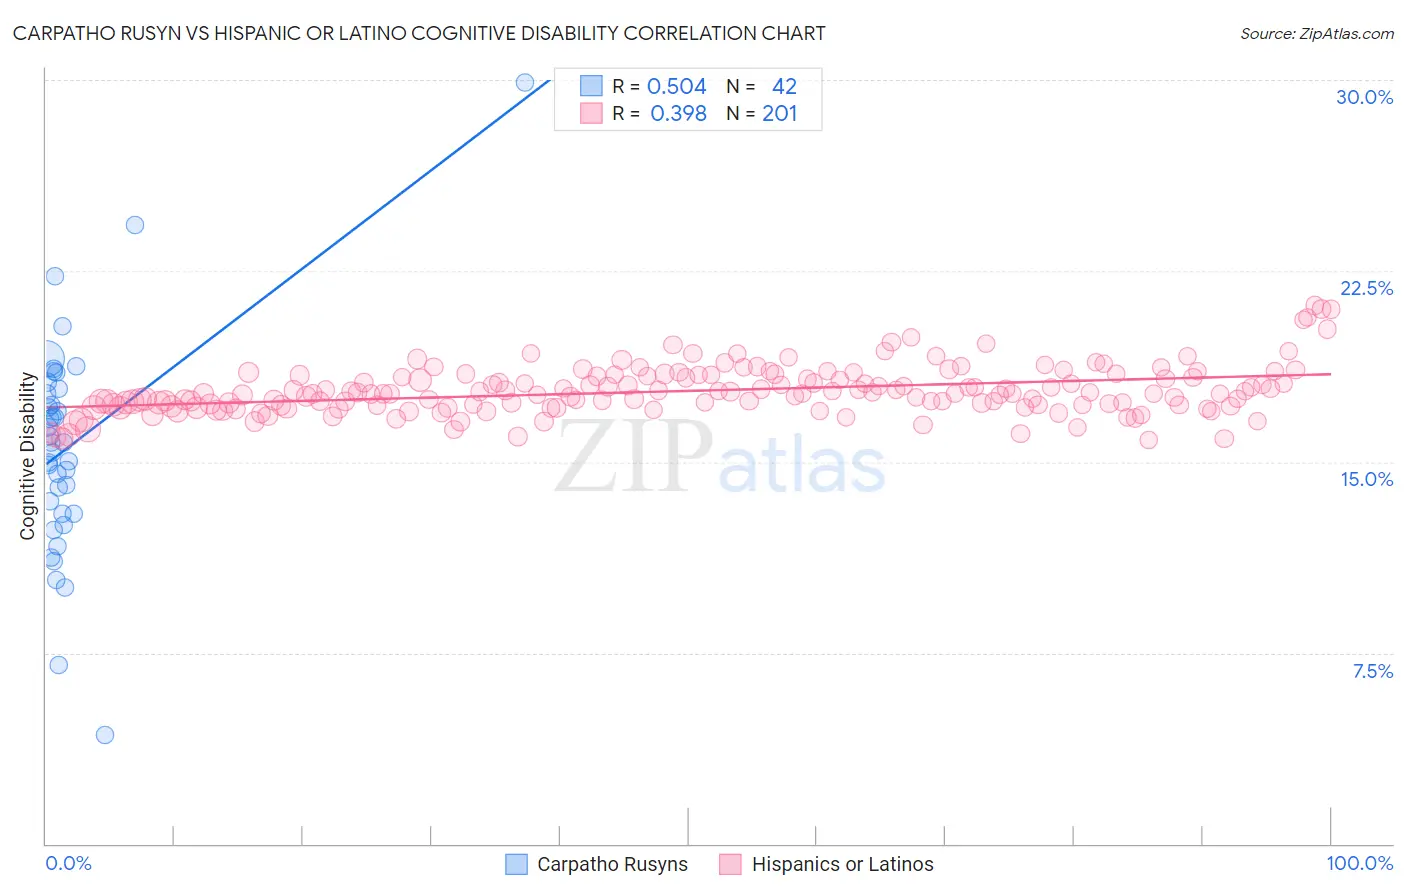
Carpatho Rusyn vs Hispanic or Latino Cognitive Disability Correlation Chart
The statistical analysis conducted on geographies consisting of 58,872,415 people shows a substantial positive correlation between the proportion of Carpatho Rusyns and percentage of population with cognitive disability in the United States with a correlation coefficient (R) of 0.504 and weighted average of 17.0%. Similarly, the statistical analysis conducted on geographies consisting of 578,401,671 people shows a mild positive correlation between the proportion of Hispanics or Latinos and percentage of population with cognitive disability in the United States with a correlation coefficient (R) of 0.398 and weighted average of 17.9%, a difference of 5.2%.
Cognitive Disability Correlation Summary
| Measurement | Carpatho Rusyn | Hispanic or Latino |
| Minimum | 4.3% | 15.8% |
| Maximum | 29.9% | 21.1% |
| Range | 25.6% | 5.3% |
| Mean | 15.6% | 17.8% |
| Median | 15.8% | 17.7% |
| Interquartile 25% (IQ1) | 13.0% | 17.2% |
| Interquartile 75% (IQ3) | 17.9% | 18.4% |
| Interquartile Range (IQR) | 4.9% | 1.2% |
| Standard Deviation (Sample) | 4.4% | 0.96% |
| Standard Deviation (Population) | 4.3% | 0.96% |
Similar Demographics by Cognitive Disability
Demographics Similar to Carpatho Rusyns by Cognitive Disability
In terms of cognitive disability, the demographic groups most similar to Carpatho Rusyns are Aleut (17.0%, a difference of 0.020%), British (17.0%, a difference of 0.020%), Immigrants from Brazil (17.0%, a difference of 0.020%), French (17.0%, a difference of 0.030%), and Chilean (17.0%, a difference of 0.030%).
| Demographics | Rating | Rank | Cognitive Disability |
| Lebanese | 91.3 /100 | #135 | Exceptional 17.0% |
| Israelis | 91.0 /100 | #136 | Exceptional 17.0% |
| Immigrants | Norway | 90.9 /100 | #137 | Exceptional 17.0% |
| Welsh | 90.8 /100 | #138 | Exceptional 17.0% |
| French | 90.0 /100 | #139 | Excellent 17.0% |
| Chileans | 89.9 /100 | #140 | Excellent 17.0% |
| Aleuts | 89.9 /100 | #141 | Excellent 17.0% |
| Carpatho Rusyns | 89.6 /100 | #142 | Excellent 17.0% |
| British | 89.3 /100 | #143 | Excellent 17.0% |
| Immigrants | Brazil | 89.3 /100 | #144 | Excellent 17.0% |
| Immigrants | South Eastern Asia | 88.7 /100 | #145 | Excellent 17.0% |
| Costa Ricans | 88.0 /100 | #146 | Excellent 17.0% |
| Scotch-Irish | 85.9 /100 | #147 | Excellent 17.1% |
| French Canadians | 85.7 /100 | #148 | Excellent 17.1% |
| Cypriots | 85.7 /100 | #149 | Excellent 17.1% |
Demographics Similar to Hispanics or Latinos by Cognitive Disability
In terms of cognitive disability, the demographic groups most similar to Hispanics or Latinos are Hopi (17.9%, a difference of 0.0%), Immigrants from the Azores (17.9%, a difference of 0.0%), Bahamian (17.9%, a difference of 0.010%), Immigrants from Grenada (17.9%, a difference of 0.020%), and Cree (17.9%, a difference of 0.030%).
| Demographics | Rating | Rank | Cognitive Disability |
| Samoans | 0.7 /100 | #247 | Tragic 17.9% |
| French American Indians | 0.7 /100 | #248 | Tragic 17.9% |
| Cree | 0.7 /100 | #249 | Tragic 17.9% |
| Immigrants | Ethiopia | 0.7 /100 | #250 | Tragic 17.9% |
| Malaysians | 0.6 /100 | #251 | Tragic 17.9% |
| Immigrants | Grenada | 0.6 /100 | #252 | Tragic 17.9% |
| Hopi | 0.6 /100 | #253 | Tragic 17.9% |
| Hispanics or Latinos | 0.6 /100 | #254 | Tragic 17.9% |
| Immigrants | Azores | 0.6 /100 | #255 | Tragic 17.9% |
| Bahamians | 0.6 /100 | #256 | Tragic 17.9% |
| Mexican American Indians | 0.6 /100 | #257 | Tragic 17.9% |
| Immigrants | Armenia | 0.6 /100 | #258 | Tragic 17.9% |
| Ethiopians | 0.5 /100 | #259 | Tragic 17.9% |
| Immigrants | Belize | 0.5 /100 | #260 | Tragic 17.9% |
| Guamanians/Chamorros | 0.5 /100 | #261 | Tragic 17.9% |