Chickasaw vs Immigrants from Taiwan Cognitive Disability
COMPARE
Chickasaw
Immigrants from Taiwan
Cognitive Disability
Cognitive Disability Comparison
Chickasaw
Immigrants from Taiwan
18.5%
COGNITIVE DISABILITY
0.0/ 100
METRIC RATING
312th/ 347
METRIC RANK
15.7%
COGNITIVE DISABILITY
100.0/ 100
METRIC RATING
1st/ 347
METRIC RANK
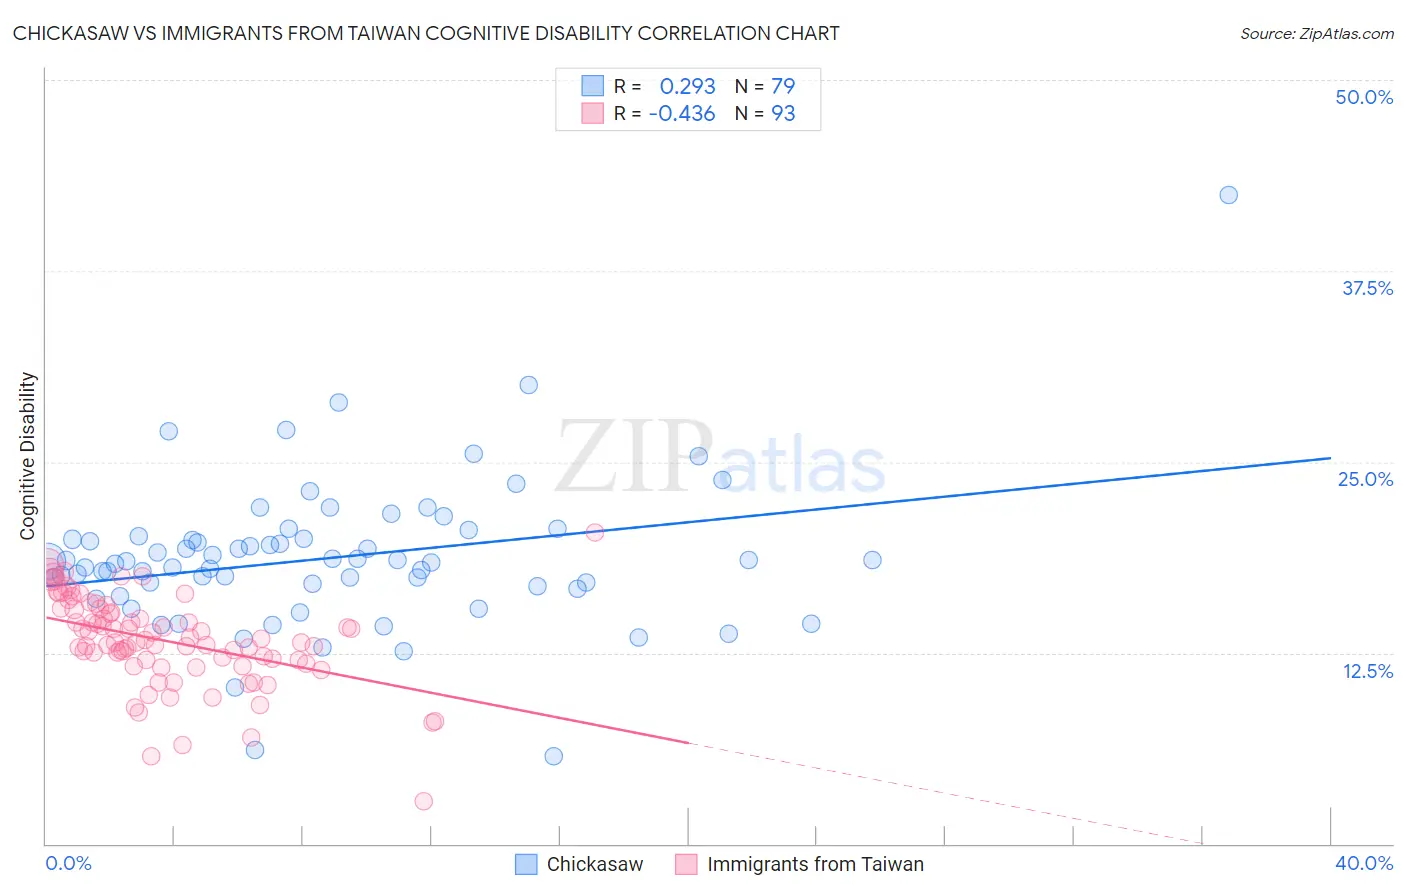
Chickasaw vs Immigrants from Taiwan Cognitive Disability Correlation Chart
The statistical analysis conducted on geographies consisting of 147,689,565 people shows a weak positive correlation between the proportion of Chickasaw and percentage of population with cognitive disability in the United States with a correlation coefficient (R) of 0.293 and weighted average of 18.5%. Similarly, the statistical analysis conducted on geographies consisting of 298,281,408 people shows a moderate negative correlation between the proportion of Immigrants from Taiwan and percentage of population with cognitive disability in the United States with a correlation coefficient (R) of -0.436 and weighted average of 15.7%, a difference of 17.7%.
Cognitive Disability Correlation Summary
| Measurement | Chickasaw | Immigrants from Taiwan |
| Minimum | 5.7% | 2.8% |
| Maximum | 42.5% | 20.4% |
| Range | 36.8% | 17.6% |
| Mean | 18.7% | 13.3% |
| Median | 18.5% | 13.2% |
| Interquartile 25% (IQ1) | 16.9% | 11.9% |
| Interquartile 75% (IQ3) | 20.0% | 15.4% |
| Interquartile Range (IQR) | 3.1% | 3.5% |
| Standard Deviation (Sample) | 4.9% | 3.0% |
| Standard Deviation (Population) | 4.9% | 3.0% |
Similar Demographics by Cognitive Disability
Demographics Similar to Chickasaw by Cognitive Disability
In terms of cognitive disability, the demographic groups most similar to Chickasaw are Yaqui (18.5%, a difference of 0.11%), Subsaharan African (18.5%, a difference of 0.17%), Hmong (18.4%, a difference of 0.29%), Choctaw (18.4%, a difference of 0.31%), and Immigrants from Dominica (18.6%, a difference of 0.35%).
| Demographics | Rating | Rank | Cognitive Disability |
| Colville | 0.0 /100 | #305 | Tragic 18.3% |
| Seminole | 0.0 /100 | #306 | Tragic 18.3% |
| Ugandans | 0.0 /100 | #307 | Tragic 18.3% |
| Immigrants | Western Africa | 0.0 /100 | #308 | Tragic 18.4% |
| Immigrants | Eastern Africa | 0.0 /100 | #309 | Tragic 18.4% |
| Choctaw | 0.0 /100 | #310 | Tragic 18.4% |
| Hmong | 0.0 /100 | #311 | Tragic 18.4% |
| Chickasaw | 0.0 /100 | #312 | Tragic 18.5% |
| Yaqui | 0.0 /100 | #313 | Tragic 18.5% |
| Sub-Saharan Africans | 0.0 /100 | #314 | Tragic 18.5% |
| Immigrants | Dominica | 0.0 /100 | #315 | Tragic 18.6% |
| Immigrants | Middle Africa | 0.0 /100 | #316 | Tragic 18.6% |
| Liberians | 0.0 /100 | #317 | Tragic 18.6% |
| Bangladeshis | 0.0 /100 | #318 | Tragic 18.6% |
| Comanche | 0.0 /100 | #319 | Tragic 18.6% |
Demographics Similar to Immigrants from Taiwan by Cognitive Disability
In terms of cognitive disability, the demographic groups most similar to Immigrants from Taiwan are Immigrants from India (15.9%, a difference of 1.3%), Chinese (15.9%, a difference of 1.3%), Immigrants from Lithuania (16.0%, a difference of 1.5%), Immigrants from Hong Kong (16.0%, a difference of 1.9%), and Thai (16.1%, a difference of 2.6%).
| Demographics | Rating | Rank | Cognitive Disability |
| Immigrants | Taiwan | 100.0 /100 | #1 | Exceptional 15.7% |
| Immigrants | India | 100.0 /100 | #2 | Exceptional 15.9% |
| Chinese | 100.0 /100 | #3 | Exceptional 15.9% |
| Immigrants | Lithuania | 100.0 /100 | #4 | Exceptional 16.0% |
| Immigrants | Hong Kong | 100.0 /100 | #5 | Exceptional 16.0% |
| Thais | 100.0 /100 | #6 | Exceptional 16.1% |
| Immigrants | Ireland | 100.0 /100 | #7 | Exceptional 16.1% |
| Immigrants | Poland | 100.0 /100 | #8 | Exceptional 16.1% |
| Assyrians/Chaldeans/Syriacs | 100.0 /100 | #9 | Exceptional 16.2% |
| Immigrants | Scotland | 100.0 /100 | #10 | Exceptional 16.2% |
| Immigrants | Czechoslovakia | 100.0 /100 | #11 | Exceptional 16.2% |
| Maltese | 100.0 /100 | #12 | Exceptional 16.2% |
| Lithuanians | 100.0 /100 | #13 | Exceptional 16.3% |
| Immigrants | Austria | 100.0 /100 | #14 | Exceptional 16.3% |
| Immigrants | Greece | 100.0 /100 | #15 | Exceptional 16.3% |