Celtic vs Welsh High School Diploma
COMPARE
Celtic
Welsh
High School Diploma
High School Diploma Comparison
Celtics
Welsh
90.6%
HIGH SCHOOL DIPLOMA
98.7/ 100
METRIC RATING
90th/ 347
METRIC RANK
91.2%
HIGH SCHOOL DIPLOMA
99.8/ 100
METRIC RATING
50th/ 347
METRIC RANK
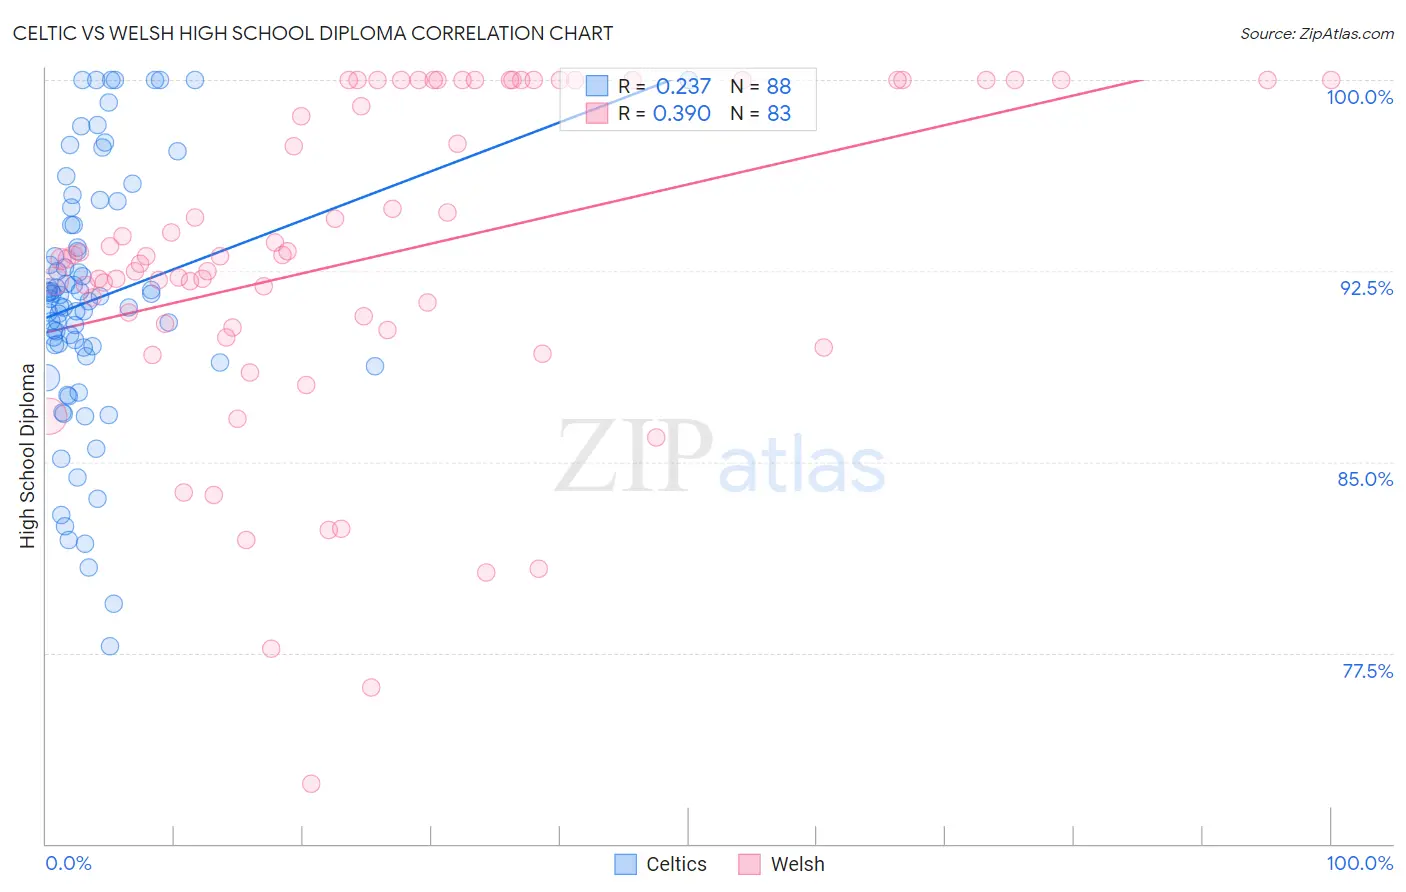
Celtic vs Welsh High School Diploma Correlation Chart
The statistical analysis conducted on geographies consisting of 168,876,981 people shows a weak positive correlation between the proportion of Celtics and percentage of population with at least high school diploma education in the United States with a correlation coefficient (R) of 0.237 and weighted average of 90.6%. Similarly, the statistical analysis conducted on geographies consisting of 528,596,196 people shows a mild positive correlation between the proportion of Welsh and percentage of population with at least high school diploma education in the United States with a correlation coefficient (R) of 0.390 and weighted average of 91.2%, a difference of 0.64%.
High School Diploma Correlation Summary
| Measurement | Celtic | Welsh |
| Minimum | 77.8% | 72.4% |
| Maximum | 100.0% | 100.0% |
| Range | 22.2% | 27.6% |
| Mean | 91.4% | 93.0% |
| Median | 91.4% | 93.1% |
| Interquartile 25% (IQ1) | 89.3% | 90.3% |
| Interquartile 75% (IQ3) | 94.3% | 100.0% |
| Interquartile Range (IQR) | 5.0% | 9.7% |
| Standard Deviation (Sample) | 5.0% | 6.4% |
| Standard Deviation (Population) | 5.0% | 6.3% |
Similar Demographics by High School Diploma
Demographics Similar to Celtics by High School Diploma
In terms of high school diploma, the demographic groups most similar to Celtics are Canadian (90.6%, a difference of 0.010%), South African (90.6%, a difference of 0.020%), Immigrants from France (90.6%, a difference of 0.030%), Swiss (90.6%, a difference of 0.030%), and Immigrants from Western Europe (90.6%, a difference of 0.040%).
| Demographics | Rating | Rank | High School Diploma |
| Immigrants | Moldova | 99.2 /100 | #83 | Exceptional 90.7% |
| Immigrants | Saudi Arabia | 99.1 /100 | #84 | Exceptional 90.7% |
| Romanians | 98.9 /100 | #85 | Exceptional 90.7% |
| Immigrants | Bulgaria | 98.9 /100 | #86 | Exceptional 90.6% |
| Immigrants | Turkey | 98.9 /100 | #87 | Exceptional 90.6% |
| Immigrants | France | 98.8 /100 | #88 | Exceptional 90.6% |
| Canadians | 98.7 /100 | #89 | Exceptional 90.6% |
| Celtics | 98.7 /100 | #90 | Exceptional 90.6% |
| South Africans | 98.6 /100 | #91 | Exceptional 90.6% |
| Swiss | 98.6 /100 | #92 | Exceptional 90.6% |
| Immigrants | Western Europe | 98.6 /100 | #93 | Exceptional 90.6% |
| Immigrants | Israel | 98.5 /100 | #94 | Exceptional 90.5% |
| Icelanders | 98.5 /100 | #95 | Exceptional 90.5% |
| Immigrants | Serbia | 98.4 /100 | #96 | Exceptional 90.5% |
| Immigrants | Kuwait | 98.3 /100 | #97 | Exceptional 90.5% |
Demographics Similar to Welsh by High School Diploma
In terms of high school diploma, the demographic groups most similar to Welsh are Bhutanese (91.2%, a difference of 0.020%), Australian (91.2%, a difference of 0.030%), Belgian (91.2%, a difference of 0.030%), Greek (91.2%, a difference of 0.040%), and New Zealander (91.1%, a difference of 0.050%).
| Demographics | Rating | Rank | High School Diploma |
| British | 99.8 /100 | #43 | Exceptional 91.3% |
| Immigrants | Austria | 99.8 /100 | #44 | Exceptional 91.3% |
| Turks | 99.8 /100 | #45 | Exceptional 91.2% |
| Greeks | 99.8 /100 | #46 | Exceptional 91.2% |
| Australians | 99.8 /100 | #47 | Exceptional 91.2% |
| Belgians | 99.8 /100 | #48 | Exceptional 91.2% |
| Bhutanese | 99.8 /100 | #49 | Exceptional 91.2% |
| Welsh | 99.8 /100 | #50 | Exceptional 91.2% |
| New Zealanders | 99.7 /100 | #51 | Exceptional 91.1% |
| Immigrants | Sweden | 99.7 /100 | #52 | Exceptional 91.1% |
| Immigrants | Belgium | 99.7 /100 | #53 | Exceptional 91.1% |
| Macedonians | 99.7 /100 | #54 | Exceptional 91.1% |
| Serbians | 99.7 /100 | #55 | Exceptional 91.1% |
| Immigrants | Canada | 99.7 /100 | #56 | Exceptional 91.1% |
| Zimbabweans | 99.7 /100 | #57 | Exceptional 91.1% |