Immigrants from Guyana vs Welsh Ambulatory Disability
COMPARE
Immigrants from Guyana
Welsh
Ambulatory Disability
Ambulatory Disability Comparison
Immigrants from Guyana
Welsh
6.7%
AMBULATORY DISABILITY
0.1/ 100
METRIC RATING
275th/ 347
METRIC RANK
6.5%
AMBULATORY DISABILITY
0.6/ 100
METRIC RATING
255th/ 347
METRIC RANK
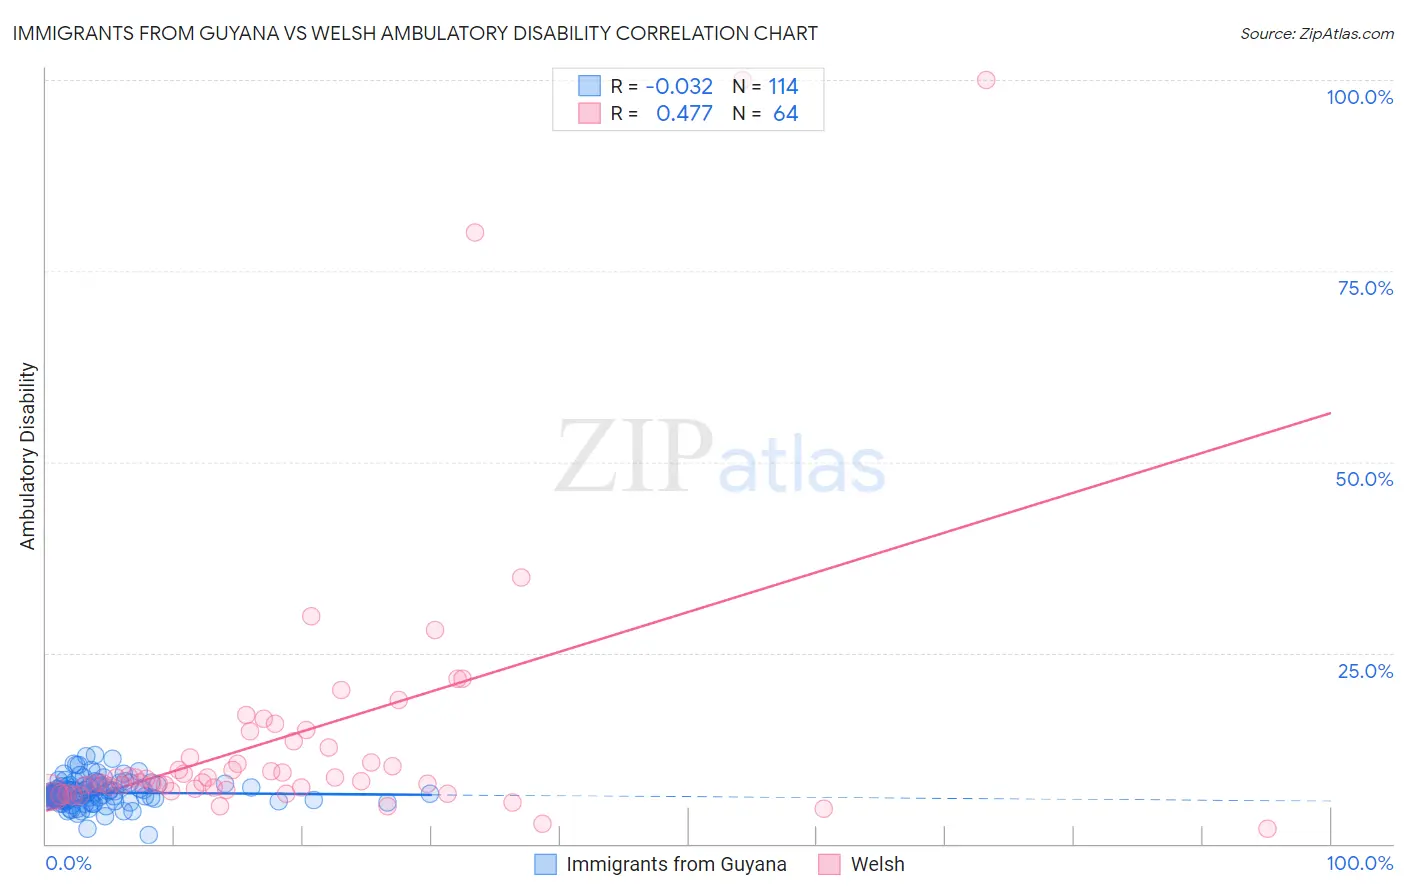
Immigrants from Guyana vs Welsh Ambulatory Disability Correlation Chart
The statistical analysis conducted on geographies consisting of 183,703,785 people shows no correlation between the proportion of Immigrants from Guyana and percentage of population with ambulatory disability in the United States with a correlation coefficient (R) of -0.032 and weighted average of 6.7%. Similarly, the statistical analysis conducted on geographies consisting of 528,297,668 people shows a moderate positive correlation between the proportion of Welsh and percentage of population with ambulatory disability in the United States with a correlation coefficient (R) of 0.477 and weighted average of 6.5%, a difference of 2.8%.
Ambulatory Disability Correlation Summary
| Measurement | Immigrants from Guyana | Welsh |
| Minimum | 1.2% | 2.0% |
| Maximum | 11.6% | 100.0% |
| Range | 10.4% | 98.0% |
| Mean | 6.7% | 14.3% |
| Median | 6.5% | 8.3% |
| Interquartile 25% (IQ1) | 5.7% | 7.1% |
| Interquartile 75% (IQ3) | 7.6% | 13.0% |
| Interquartile Range (IQR) | 1.9% | 5.9% |
| Standard Deviation (Sample) | 1.7% | 18.8% |
| Standard Deviation (Population) | 1.7% | 18.7% |
Demographics Similar to Immigrants from Guyana and Welsh by Ambulatory Disability
In terms of ambulatory disability, the demographic groups most similar to Immigrants from Guyana are Sioux (6.7%, a difference of 0.060%), White/Caucasian (6.7%, a difference of 0.31%), French Canadian (6.7%, a difference of 0.32%), Immigrants from Trinidad and Tobago (6.7%, a difference of 0.69%), and Slovak (6.7%, a difference of 0.79%). Similarly, the demographic groups most similar to Welsh are Immigrants from Uzbekistan (6.5%, a difference of 0.080%), Bermudan (6.5%, a difference of 0.16%), Spanish American Indian (6.5%, a difference of 0.23%), Aleut (6.6%, a difference of 0.42%), and Immigrants from Belize (6.6%, a difference of 0.43%).
| Demographics | Rating | Rank | Ambulatory Disability |
| Welsh | 0.6 /100 | #255 | Tragic 6.5% |
| Immigrants | Uzbekistan | 0.6 /100 | #256 | Tragic 6.5% |
| Bermudans | 0.5 /100 | #257 | Tragic 6.5% |
| Spanish American Indians | 0.5 /100 | #258 | Tragic 6.5% |
| Aleuts | 0.4 /100 | #259 | Tragic 6.6% |
| Immigrants | Belize | 0.4 /100 | #260 | Tragic 6.6% |
| Irish | 0.4 /100 | #261 | Tragic 6.6% |
| English | 0.4 /100 | #262 | Tragic 6.6% |
| Hmong | 0.3 /100 | #263 | Tragic 6.6% |
| Nepalese | 0.2 /100 | #264 | Tragic 6.6% |
| Bahamians | 0.2 /100 | #265 | Tragic 6.6% |
| Guyanese | 0.2 /100 | #266 | Tragic 6.6% |
| Trinidadians and Tobagonians | 0.2 /100 | #267 | Tragic 6.6% |
| Spanish | 0.2 /100 | #268 | Tragic 6.6% |
| French | 0.1 /100 | #269 | Tragic 6.6% |
| Slovaks | 0.1 /100 | #270 | Tragic 6.7% |
| Immigrants | Trinidad and Tobago | 0.1 /100 | #271 | Tragic 6.7% |
| French Canadians | 0.1 /100 | #272 | Tragic 6.7% |
| Whites/Caucasians | 0.1 /100 | #273 | Tragic 6.7% |
| Sioux | 0.1 /100 | #274 | Tragic 6.7% |
| Immigrants | Guyana | 0.1 /100 | #275 | Tragic 6.7% |