Bahamian vs Welsh Ambulatory Disability
COMPARE
Bahamian
Welsh
Ambulatory Disability
Ambulatory Disability Comparison
Bahamians
Welsh
6.6%
AMBULATORY DISABILITY
0.2/ 100
METRIC RATING
265th/ 347
METRIC RANK
6.5%
AMBULATORY DISABILITY
0.6/ 100
METRIC RATING
255th/ 347
METRIC RANK
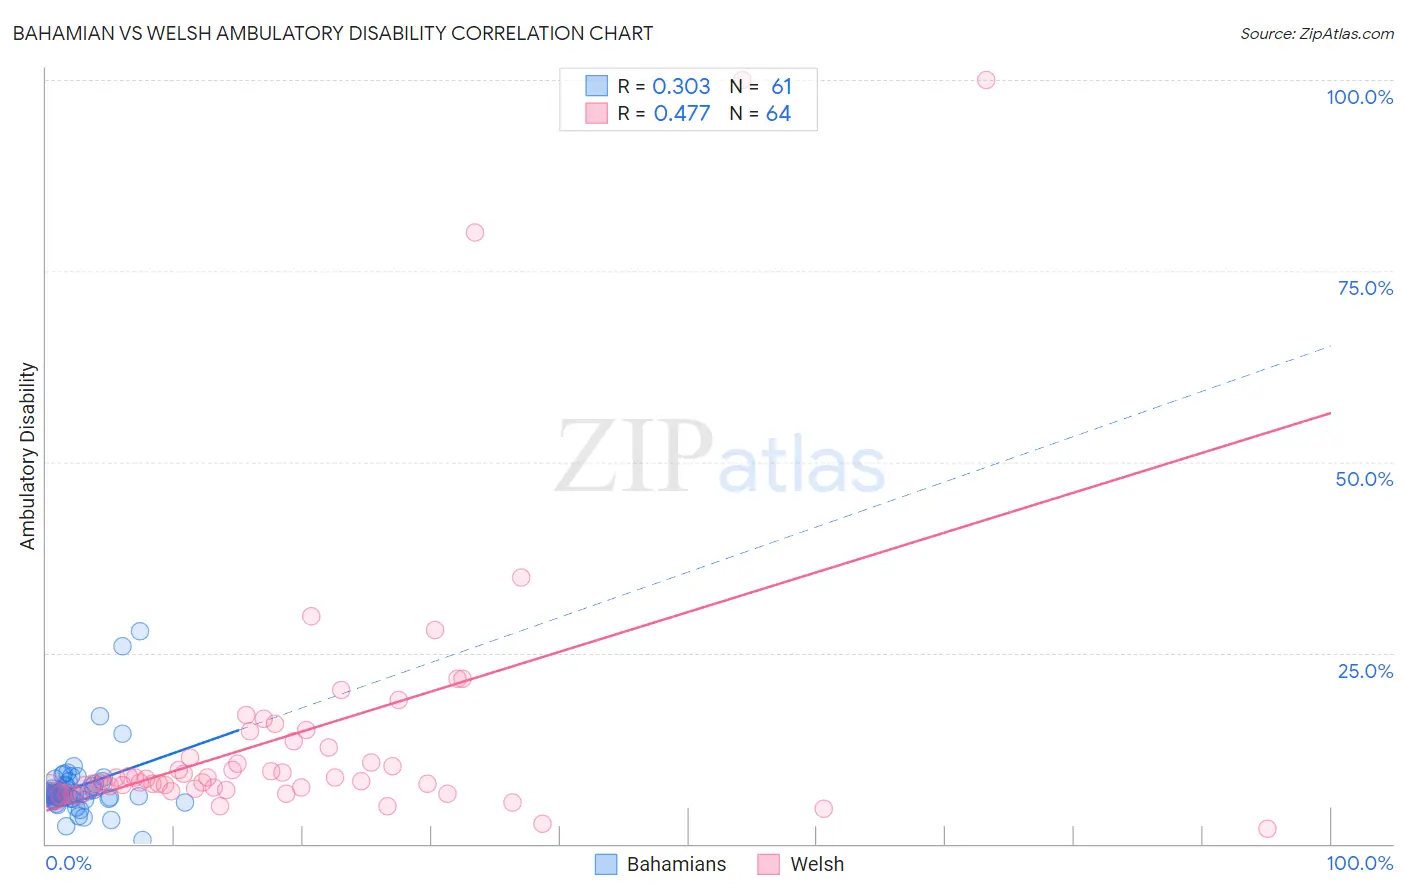
Bahamian vs Welsh Ambulatory Disability Correlation Chart
The statistical analysis conducted on geographies consisting of 112,670,822 people shows a mild positive correlation between the proportion of Bahamians and percentage of population with ambulatory disability in the United States with a correlation coefficient (R) of 0.303 and weighted average of 6.6%. Similarly, the statistical analysis conducted on geographies consisting of 528,297,668 people shows a moderate positive correlation between the proportion of Welsh and percentage of population with ambulatory disability in the United States with a correlation coefficient (R) of 0.477 and weighted average of 6.5%, a difference of 1.3%.
Ambulatory Disability Correlation Summary
| Measurement | Bahamian | Welsh |
| Minimum | 0.55% | 2.0% |
| Maximum | 27.8% | 100.0% |
| Range | 27.3% | 98.0% |
| Mean | 7.4% | 14.3% |
| Median | 6.6% | 8.3% |
| Interquartile 25% (IQ1) | 5.9% | 7.1% |
| Interquartile 75% (IQ3) | 7.8% | 13.0% |
| Interquartile Range (IQR) | 1.9% | 5.9% |
| Standard Deviation (Sample) | 4.3% | 18.8% |
| Standard Deviation (Population) | 4.3% | 18.7% |
Demographics Similar to Bahamians and Welsh by Ambulatory Disability
In terms of ambulatory disability, the demographic groups most similar to Bahamians are Nepalese (6.6%, a difference of 0.060%), Guyanese (6.6%, a difference of 0.12%), Trinidadian and Tobagonian (6.6%, a difference of 0.25%), Spanish (6.6%, a difference of 0.26%), and Hmong (6.6%, a difference of 0.46%). Similarly, the demographic groups most similar to Welsh are Belizean (6.5%, a difference of 0.070%), Immigrants from Uzbekistan (6.5%, a difference of 0.080%), Bermudan (6.5%, a difference of 0.16%), Scottish (6.5%, a difference of 0.23%), and Spanish American Indian (6.5%, a difference of 0.23%).
| Demographics | Rating | Rank | Ambulatory Disability |
| Chinese | 1.0 /100 | #250 | Tragic 6.5% |
| Hawaiians | 0.9 /100 | #251 | Tragic 6.5% |
| Immigrants | Bahamas | 0.8 /100 | #252 | Tragic 6.5% |
| Scottish | 0.7 /100 | #253 | Tragic 6.5% |
| Belizeans | 0.7 /100 | #254 | Tragic 6.5% |
| Welsh | 0.6 /100 | #255 | Tragic 6.5% |
| Immigrants | Uzbekistan | 0.6 /100 | #256 | Tragic 6.5% |
| Bermudans | 0.5 /100 | #257 | Tragic 6.5% |
| Spanish American Indians | 0.5 /100 | #258 | Tragic 6.5% |
| Aleuts | 0.4 /100 | #259 | Tragic 6.6% |
| Immigrants | Belize | 0.4 /100 | #260 | Tragic 6.6% |
| Irish | 0.4 /100 | #261 | Tragic 6.6% |
| English | 0.4 /100 | #262 | Tragic 6.6% |
| Hmong | 0.3 /100 | #263 | Tragic 6.6% |
| Nepalese | 0.2 /100 | #264 | Tragic 6.6% |
| Bahamians | 0.2 /100 | #265 | Tragic 6.6% |
| Guyanese | 0.2 /100 | #266 | Tragic 6.6% |
| Trinidadians and Tobagonians | 0.2 /100 | #267 | Tragic 6.6% |
| Spanish | 0.2 /100 | #268 | Tragic 6.6% |
| French | 0.1 /100 | #269 | Tragic 6.6% |
| Slovaks | 0.1 /100 | #270 | Tragic 6.7% |