Mexican vs Welsh Ambulatory Disability
COMPARE
Mexican
Welsh
Ambulatory Disability
Ambulatory Disability Comparison
Mexicans
Welsh
6.4%
AMBULATORY DISABILITY
3.5/ 100
METRIC RATING
230th/ 347
METRIC RANK
6.5%
AMBULATORY DISABILITY
0.6/ 100
METRIC RATING
255th/ 347
METRIC RANK
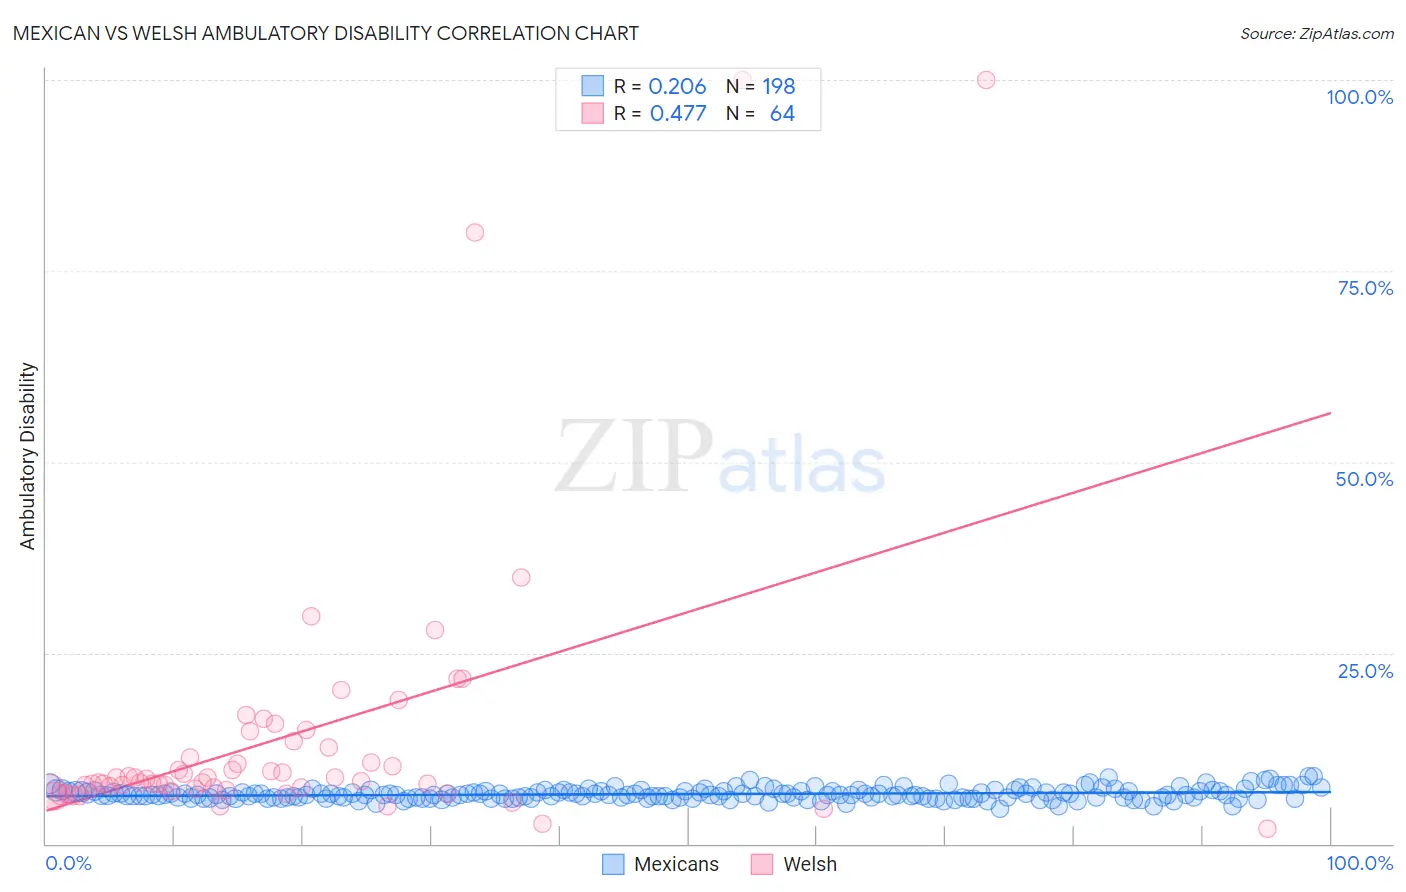
Mexican vs Welsh Ambulatory Disability Correlation Chart
The statistical analysis conducted on geographies consisting of 564,662,817 people shows a weak positive correlation between the proportion of Mexicans and percentage of population with ambulatory disability in the United States with a correlation coefficient (R) of 0.206 and weighted average of 6.4%. Similarly, the statistical analysis conducted on geographies consisting of 528,297,668 people shows a moderate positive correlation between the proportion of Welsh and percentage of population with ambulatory disability in the United States with a correlation coefficient (R) of 0.477 and weighted average of 6.5%, a difference of 2.2%.
Ambulatory Disability Correlation Summary
| Measurement | Mexican | Welsh |
| Minimum | 4.5% | 2.0% |
| Maximum | 8.9% | 100.0% |
| Range | 4.4% | 98.0% |
| Mean | 6.5% | 14.3% |
| Median | 6.4% | 8.3% |
| Interquartile 25% (IQ1) | 6.0% | 7.1% |
| Interquartile 75% (IQ3) | 6.9% | 13.0% |
| Interquartile Range (IQR) | 0.88% | 5.9% |
| Standard Deviation (Sample) | 0.72% | 18.8% |
| Standard Deviation (Population) | 0.72% | 18.7% |
Similar Demographics by Ambulatory Disability
Demographics Similar to Mexicans by Ambulatory Disability
In terms of ambulatory disability, the demographic groups most similar to Mexicans are Czechoslovakian (6.4%, a difference of 0.11%), Portuguese (6.4%, a difference of 0.15%), Panamanian (6.4%, a difference of 0.16%), Cuban (6.4%, a difference of 0.17%), and Slavic (6.4%, a difference of 0.49%).
| Demographics | Rating | Rank | Ambulatory Disability |
| Immigrants | Honduras | 7.6 /100 | #223 | Tragic 6.3% |
| Liberians | 7.1 /100 | #224 | Tragic 6.3% |
| Hondurans | 6.3 /100 | #225 | Tragic 6.3% |
| Slavs | 5.1 /100 | #226 | Tragic 6.4% |
| Cubans | 4.0 /100 | #227 | Tragic 6.4% |
| Portuguese | 4.0 /100 | #228 | Tragic 6.4% |
| Czechoslovakians | 3.8 /100 | #229 | Tragic 6.4% |
| Mexicans | 3.5 /100 | #230 | Tragic 6.4% |
| Panamanians | 3.1 /100 | #231 | Tragic 6.4% |
| Assyrians/Chaldeans/Syriacs | 2.4 /100 | #232 | Tragic 6.4% |
| Sub-Saharan Africans | 2.3 /100 | #233 | Tragic 6.4% |
| Immigrants | Liberia | 2.3 /100 | #234 | Tragic 6.4% |
| Hispanics or Latinos | 2.2 /100 | #235 | Tragic 6.4% |
| Dutch | 2.0 /100 | #236 | Tragic 6.4% |
| Immigrants | Germany | 1.8 /100 | #237 | Tragic 6.4% |
Demographics Similar to Welsh by Ambulatory Disability
In terms of ambulatory disability, the demographic groups most similar to Welsh are Belizean (6.5%, a difference of 0.070%), Immigrants from Uzbekistan (6.5%, a difference of 0.080%), Bermudan (6.5%, a difference of 0.16%), Scottish (6.5%, a difference of 0.23%), and Spanish American Indian (6.5%, a difference of 0.23%).
| Demographics | Rating | Rank | Ambulatory Disability |
| Immigrants | Portugal | 1.4 /100 | #248 | Tragic 6.5% |
| Native Hawaiians | 1.1 /100 | #249 | Tragic 6.5% |
| Chinese | 1.0 /100 | #250 | Tragic 6.5% |
| Hawaiians | 0.9 /100 | #251 | Tragic 6.5% |
| Immigrants | Bahamas | 0.8 /100 | #252 | Tragic 6.5% |
| Scottish | 0.7 /100 | #253 | Tragic 6.5% |
| Belizeans | 0.7 /100 | #254 | Tragic 6.5% |
| Welsh | 0.6 /100 | #255 | Tragic 6.5% |
| Immigrants | Uzbekistan | 0.6 /100 | #256 | Tragic 6.5% |
| Bermudans | 0.5 /100 | #257 | Tragic 6.5% |
| Spanish American Indians | 0.5 /100 | #258 | Tragic 6.5% |
| Aleuts | 0.4 /100 | #259 | Tragic 6.6% |
| Immigrants | Belize | 0.4 /100 | #260 | Tragic 6.6% |
| Irish | 0.4 /100 | #261 | Tragic 6.6% |
| English | 0.4 /100 | #262 | Tragic 6.6% |