Immigrants from Kuwait vs Inupiat Female Disability
COMPARE
Immigrants from Kuwait
Inupiat
Female Disability
Female Disability Comparison
Immigrants from Kuwait
Inupiat
11.1%
FEMALE DISABILITY
100.0/ 100
METRIC RATING
31st/ 347
METRIC RANK
11.3%
FEMALE DISABILITY
100.0/ 100
METRIC RATING
50th/ 347
METRIC RANK
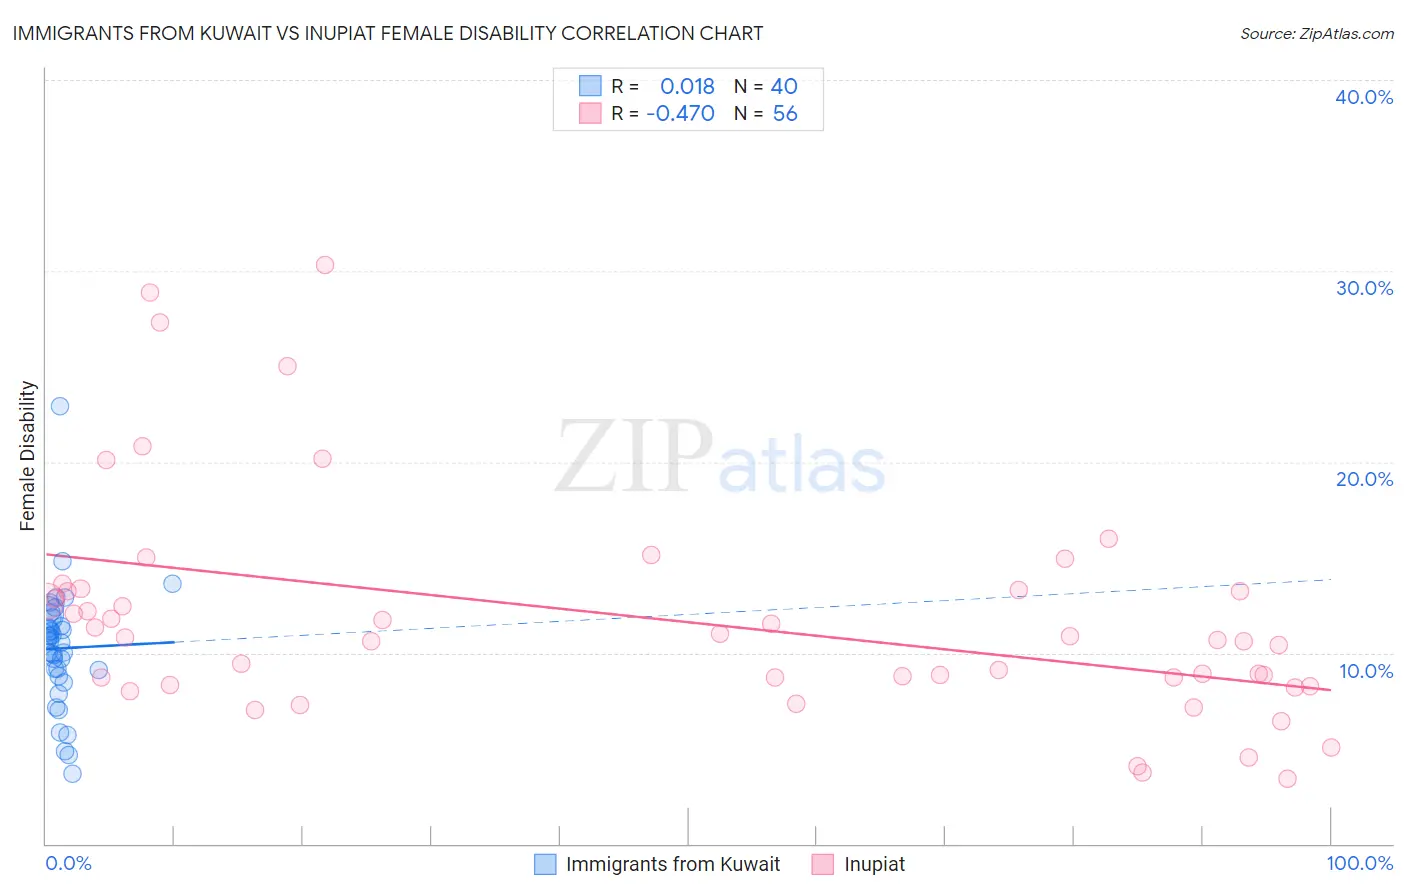
Immigrants from Kuwait vs Inupiat Female Disability Correlation Chart
The statistical analysis conducted on geographies consisting of 136,914,007 people shows no correlation between the proportion of Immigrants from Kuwait and percentage of females with a disability in the United States with a correlation coefficient (R) of 0.018 and weighted average of 11.1%. Similarly, the statistical analysis conducted on geographies consisting of 96,332,490 people shows a moderate negative correlation between the proportion of Inupiat and percentage of females with a disability in the United States with a correlation coefficient (R) of -0.470 and weighted average of 11.3%, a difference of 1.7%.
Female Disability Correlation Summary
| Measurement | Immigrants from Kuwait | Inupiat |
| Minimum | 3.7% | 3.4% |
| Maximum | 22.9% | 30.3% |
| Range | 19.3% | 26.9% |
| Mean | 10.2% | 11.8% |
| Median | 10.6% | 10.7% |
| Interquartile 25% (IQ1) | 8.9% | 8.5% |
| Interquartile 75% (IQ3) | 11.6% | 13.3% |
| Interquartile Range (IQR) | 2.7% | 4.8% |
| Standard Deviation (Sample) | 3.3% | 5.9% |
| Standard Deviation (Population) | 3.2% | 5.8% |
Demographics Similar to Immigrants from Kuwait and Inupiat by Female Disability
In terms of female disability, the demographic groups most similar to Immigrants from Kuwait are Turkish (11.1%, a difference of 0.10%), Immigrants from Australia (11.1%, a difference of 0.17%), Immigrants from Egypt (11.1%, a difference of 0.25%), Immigrants from Indonesia (11.2%, a difference of 0.50%), and Immigrants from Japan (11.2%, a difference of 0.65%). Similarly, the demographic groups most similar to Inupiat are Tongan (11.3%, a difference of 0.23%), Jordanian (11.3%, a difference of 0.24%), Zimbabwean (11.3%, a difference of 0.24%), Immigrants from Nepal (11.3%, a difference of 0.26%), and Immigrants from Sweden (11.3%, a difference of 0.31%).
| Demographics | Rating | Rank | Female Disability |
| Turks | 100.0 /100 | #30 | Exceptional 11.1% |
| Immigrants | Kuwait | 100.0 /100 | #31 | Exceptional 11.1% |
| Immigrants | Australia | 100.0 /100 | #32 | Exceptional 11.1% |
| Immigrants | Egypt | 100.0 /100 | #33 | Exceptional 11.1% |
| Immigrants | Indonesia | 100.0 /100 | #34 | Exceptional 11.2% |
| Immigrants | Japan | 100.0 /100 | #35 | Exceptional 11.2% |
| Cypriots | 100.0 /100 | #36 | Exceptional 11.2% |
| Ethiopians | 100.0 /100 | #37 | Exceptional 11.2% |
| Immigrants | Ethiopia | 100.0 /100 | #38 | Exceptional 11.2% |
| Immigrants | Lithuania | 100.0 /100 | #39 | Exceptional 11.2% |
| Mongolians | 100.0 /100 | #40 | Exceptional 11.2% |
| Paraguayans | 100.0 /100 | #41 | Exceptional 11.2% |
| Israelis | 100.0 /100 | #42 | Exceptional 11.2% |
| Afghans | 100.0 /100 | #43 | Exceptional 11.2% |
| Cambodians | 100.0 /100 | #44 | Exceptional 11.3% |
| Immigrants | Sweden | 100.0 /100 | #45 | Exceptional 11.3% |
| Immigrants | Nepal | 100.0 /100 | #46 | Exceptional 11.3% |
| Jordanians | 100.0 /100 | #47 | Exceptional 11.3% |
| Zimbabweans | 100.0 /100 | #48 | Exceptional 11.3% |
| Tongans | 100.0 /100 | #49 | Exceptional 11.3% |
| Inupiat | 100.0 /100 | #50 | Exceptional 11.3% |