Yugoslavian vs Immigrants from Egypt Self-Care Disability
COMPARE
Yugoslavian
Immigrants from Egypt
Self-Care Disability
Self-Care Disability Comparison
Yugoslavians
Immigrants from Egypt
2.5%
SELF-CARE DISABILITY
36.1/ 100
METRIC RATING
184th/ 347
METRIC RANK
2.3%
SELF-CARE DISABILITY
99.1/ 100
METRIC RATING
73rd/ 347
METRIC RANK
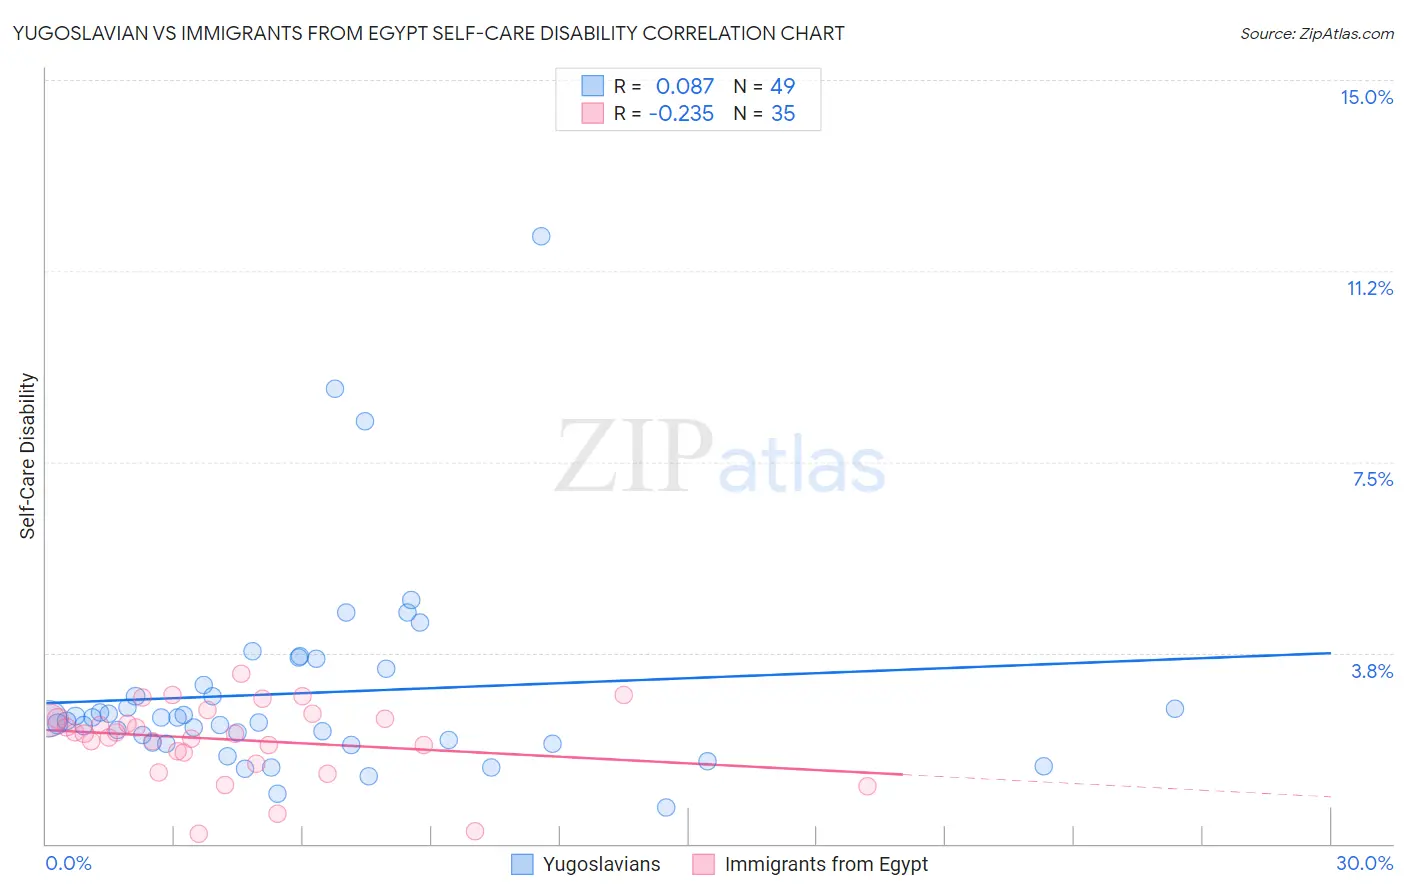
Yugoslavian vs Immigrants from Egypt Self-Care Disability Correlation Chart
The statistical analysis conducted on geographies consisting of 285,516,060 people shows a slight positive correlation between the proportion of Yugoslavians and percentage of population with self-care disability in the United States with a correlation coefficient (R) of 0.087 and weighted average of 2.5%. Similarly, the statistical analysis conducted on geographies consisting of 245,382,985 people shows a weak negative correlation between the proportion of Immigrants from Egypt and percentage of population with self-care disability in the United States with a correlation coefficient (R) of -0.235 and weighted average of 2.3%, a difference of 6.7%.
Self-Care Disability Correlation Summary
| Measurement | Yugoslavian | Immigrants from Egypt |
| Minimum | 0.70% | 0.20% |
| Maximum | 11.9% | 3.3% |
| Range | 11.2% | 3.1% |
| Mean | 3.0% | 2.0% |
| Median | 2.5% | 2.2% |
| Interquartile 25% (IQ1) | 2.0% | 1.8% |
| Interquartile 75% (IQ3) | 3.3% | 2.5% |
| Interquartile Range (IQR) | 1.3% | 0.68% |
| Standard Deviation (Sample) | 2.0% | 0.73% |
| Standard Deviation (Population) | 2.0% | 0.72% |
Similar Demographics by Self-Care Disability
Demographics Similar to Yugoslavians by Self-Care Disability
In terms of self-care disability, the demographic groups most similar to Yugoslavians are Salvadoran (2.5%, a difference of 0.020%), Maltese (2.5%, a difference of 0.070%), Slavic (2.5%, a difference of 0.090%), Immigrants from El Salvador (2.5%, a difference of 0.17%), and Ghanaian (2.5%, a difference of 0.21%).
| Demographics | Rating | Rank | Self-Care Disability |
| Immigrants | Kazakhstan | 46.7 /100 | #177 | Average 2.5% |
| English | 46.2 /100 | #178 | Average 2.5% |
| Hungarians | 45.5 /100 | #179 | Average 2.5% |
| Indonesians | 41.2 /100 | #180 | Average 2.5% |
| Ghanaians | 40.4 /100 | #181 | Average 2.5% |
| Maltese | 37.5 /100 | #182 | Fair 2.5% |
| Salvadorans | 36.4 /100 | #183 | Fair 2.5% |
| Yugoslavians | 36.1 /100 | #184 | Fair 2.5% |
| Slavs | 34.3 /100 | #185 | Fair 2.5% |
| Immigrants | El Salvador | 33.0 /100 | #186 | Fair 2.5% |
| Irish | 28.7 /100 | #187 | Fair 2.5% |
| Immigrants | Oceania | 28.3 /100 | #188 | Fair 2.5% |
| Immigrants | Eastern Europe | 28.0 /100 | #189 | Fair 2.5% |
| Sioux | 24.6 /100 | #190 | Fair 2.5% |
| Moroccans | 22.9 /100 | #191 | Fair 2.5% |
Demographics Similar to Immigrants from Egypt by Self-Care Disability
In terms of self-care disability, the demographic groups most similar to Immigrants from Egypt are Eastern European (2.3%, a difference of 0.030%), Asian (2.3%, a difference of 0.060%), Immigrants from Switzerland (2.3%, a difference of 0.060%), Immigrants from Northern Europe (2.3%, a difference of 0.090%), and Immigrants from Netherlands (2.3%, a difference of 0.10%).
| Demographics | Rating | Rank | Self-Care Disability |
| Immigrants | Argentina | 99.3 /100 | #66 | Exceptional 2.3% |
| South Africans | 99.3 /100 | #67 | Exceptional 2.3% |
| Immigrants | Zaire | 99.2 /100 | #68 | Exceptional 2.3% |
| Immigrants | Norway | 99.2 /100 | #69 | Exceptional 2.3% |
| Immigrants | Northern Europe | 99.2 /100 | #70 | Exceptional 2.3% |
| Asians | 99.2 /100 | #71 | Exceptional 2.3% |
| Eastern Europeans | 99.2 /100 | #72 | Exceptional 2.3% |
| Immigrants | Egypt | 99.1 /100 | #73 | Exceptional 2.3% |
| Immigrants | Switzerland | 99.1 /100 | #74 | Exceptional 2.3% |
| Immigrants | Netherlands | 99.1 /100 | #75 | Exceptional 2.3% |
| Immigrants | China | 99.1 /100 | #76 | Exceptional 2.3% |
| Immigrants | Middle Africa | 99.0 /100 | #77 | Exceptional 2.3% |
| Immigrants | Ireland | 99.0 /100 | #78 | Exceptional 2.3% |
| Immigrants | Kenya | 99.0 /100 | #79 | Exceptional 2.3% |
| Chileans | 98.8 /100 | #80 | Exceptional 2.3% |