Immigrants from St. Vincent and the Grenadines vs Immigrants from Egypt Self-Care Disability
COMPARE
Immigrants from St. Vincent and the Grenadines
Immigrants from Egypt
Self-Care Disability
Self-Care Disability Comparison
Immigrants from St. Vincent and the Grenadines
Immigrants from Egypt
2.8%
SELF-CARE DISABILITY
0.0/ 100
METRIC RATING
302nd/ 347
METRIC RANK
2.3%
SELF-CARE DISABILITY
99.1/ 100
METRIC RATING
73rd/ 347
METRIC RANK
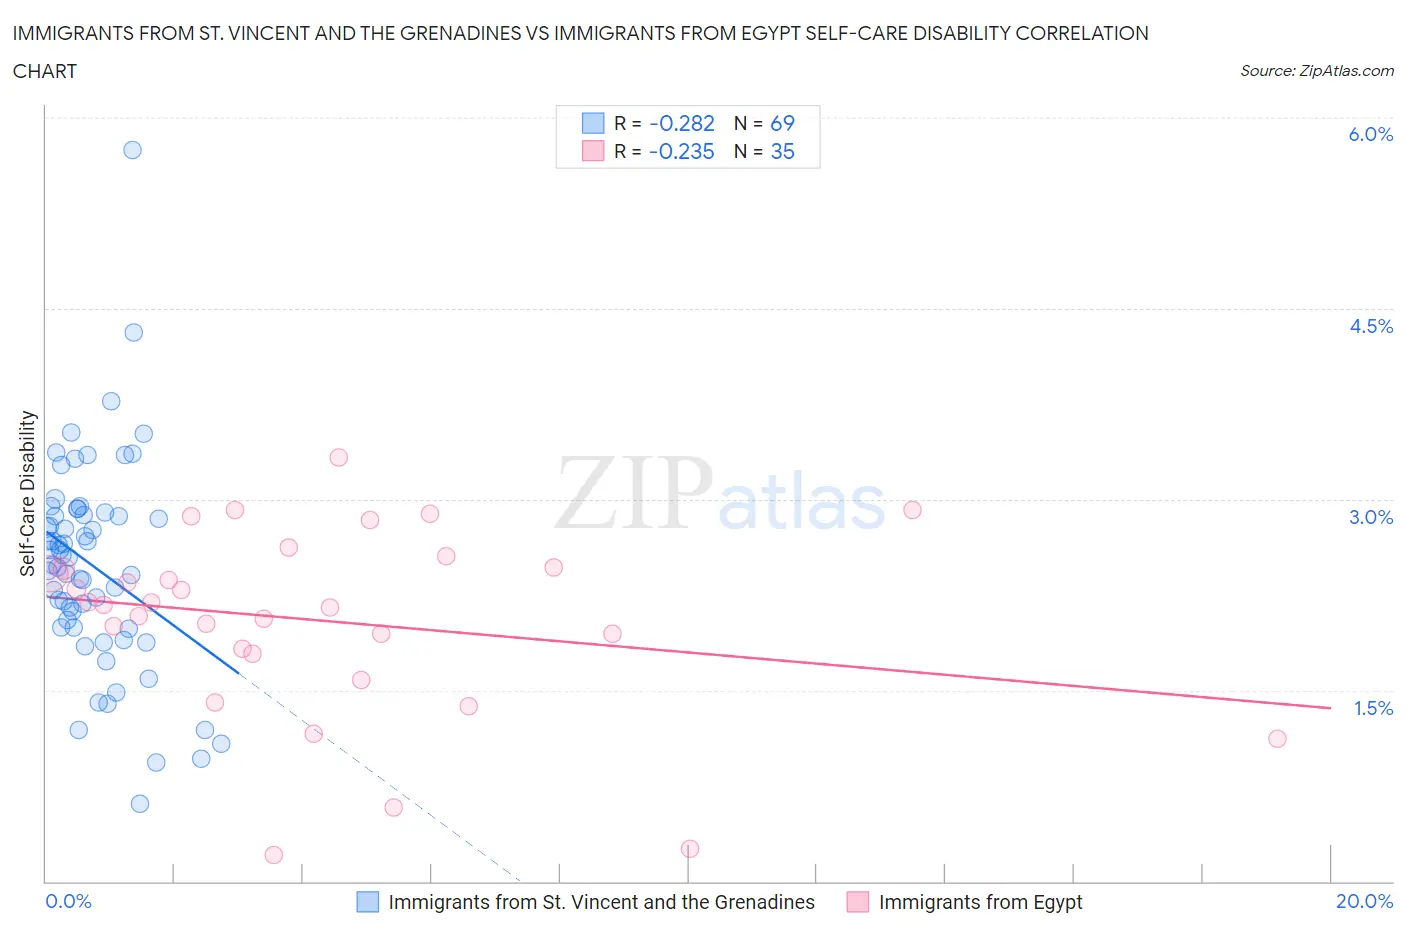
Immigrants from St. Vincent and the Grenadines vs Immigrants from Egypt Self-Care Disability Correlation Chart
The statistical analysis conducted on geographies consisting of 56,160,943 people shows a weak negative correlation between the proportion of Immigrants from St. Vincent and the Grenadines and percentage of population with self-care disability in the United States with a correlation coefficient (R) of -0.282 and weighted average of 2.8%. Similarly, the statistical analysis conducted on geographies consisting of 245,382,985 people shows a weak negative correlation between the proportion of Immigrants from Egypt and percentage of population with self-care disability in the United States with a correlation coefficient (R) of -0.235 and weighted average of 2.3%, a difference of 19.6%.
Self-Care Disability Correlation Summary
| Measurement | Immigrants from St. Vincent and the Grenadines | Immigrants from Egypt |
| Minimum | 0.61% | 0.20% |
| Maximum | 5.7% | 3.3% |
| Range | 5.1% | 3.1% |
| Mean | 2.5% | 2.0% |
| Median | 2.5% | 2.2% |
| Interquartile 25% (IQ1) | 2.0% | 1.8% |
| Interquartile 75% (IQ3) | 2.9% | 2.5% |
| Interquartile Range (IQR) | 0.89% | 0.68% |
| Standard Deviation (Sample) | 0.82% | 0.73% |
| Standard Deviation (Population) | 0.82% | 0.72% |
Similar Demographics by Self-Care Disability
Demographics Similar to Immigrants from St. Vincent and the Grenadines by Self-Care Disability
In terms of self-care disability, the demographic groups most similar to Immigrants from St. Vincent and the Grenadines are Pima (2.8%, a difference of 0.040%), Immigrants from Fiji (2.8%, a difference of 0.13%), Immigrants from Belize (2.8%, a difference of 0.15%), Cree (2.8%, a difference of 0.30%), and Immigrants from West Indies (2.8%, a difference of 0.35%).
| Demographics | Rating | Rank | Self-Care Disability |
| Barbadians | 0.0 /100 | #295 | Tragic 2.7% |
| Immigrants | Portugal | 0.0 /100 | #296 | Tragic 2.8% |
| West Indians | 0.0 /100 | #297 | Tragic 2.8% |
| Americans | 0.0 /100 | #298 | Tragic 2.8% |
| Immigrants | Guyana | 0.0 /100 | #299 | Tragic 2.8% |
| Immigrants | Fiji | 0.0 /100 | #300 | Tragic 2.8% |
| Pima | 0.0 /100 | #301 | Tragic 2.8% |
| Immigrants | St. Vincent and the Grenadines | 0.0 /100 | #302 | Tragic 2.8% |
| Immigrants | Belize | 0.0 /100 | #303 | Tragic 2.8% |
| Cree | 0.0 /100 | #304 | Tragic 2.8% |
| Immigrants | West Indies | 0.0 /100 | #305 | Tragic 2.8% |
| Aleuts | 0.0 /100 | #306 | Tragic 2.8% |
| Natives/Alaskans | 0.0 /100 | #307 | Tragic 2.8% |
| Immigrants | Grenada | 0.0 /100 | #308 | Tragic 2.8% |
| Bangladeshis | 0.0 /100 | #309 | Tragic 2.8% |
Demographics Similar to Immigrants from Egypt by Self-Care Disability
In terms of self-care disability, the demographic groups most similar to Immigrants from Egypt are Eastern European (2.3%, a difference of 0.030%), Asian (2.3%, a difference of 0.060%), Immigrants from Switzerland (2.3%, a difference of 0.060%), Immigrants from Northern Europe (2.3%, a difference of 0.090%), and Immigrants from Netherlands (2.3%, a difference of 0.10%).
| Demographics | Rating | Rank | Self-Care Disability |
| Immigrants | Argentina | 99.3 /100 | #66 | Exceptional 2.3% |
| South Africans | 99.3 /100 | #67 | Exceptional 2.3% |
| Immigrants | Zaire | 99.2 /100 | #68 | Exceptional 2.3% |
| Immigrants | Norway | 99.2 /100 | #69 | Exceptional 2.3% |
| Immigrants | Northern Europe | 99.2 /100 | #70 | Exceptional 2.3% |
| Asians | 99.2 /100 | #71 | Exceptional 2.3% |
| Eastern Europeans | 99.2 /100 | #72 | Exceptional 2.3% |
| Immigrants | Egypt | 99.1 /100 | #73 | Exceptional 2.3% |
| Immigrants | Switzerland | 99.1 /100 | #74 | Exceptional 2.3% |
| Immigrants | Netherlands | 99.1 /100 | #75 | Exceptional 2.3% |
| Immigrants | China | 99.1 /100 | #76 | Exceptional 2.3% |
| Immigrants | Middle Africa | 99.0 /100 | #77 | Exceptional 2.3% |
| Immigrants | Ireland | 99.0 /100 | #78 | Exceptional 2.3% |
| Immigrants | Kenya | 99.0 /100 | #79 | Exceptional 2.3% |
| Chileans | 98.8 /100 | #80 | Exceptional 2.3% |