Celtic vs Immigrants from Armenia In Labor Force | Age 20-64
COMPARE
Celtic
Immigrants from Armenia
In Labor Force | Age 20-64
In Labor Force | Age 20-64 Comparison
Celtics
Immigrants from Armenia
78.7%
IN LABOR FORCE | AGE 20-64
0.5/ 100
METRIC RATING
256th/ 347
METRIC RANK
79.2%
IN LABOR FORCE | AGE 20-64
12.2/ 100
METRIC RATING
214th/ 347
METRIC RANK
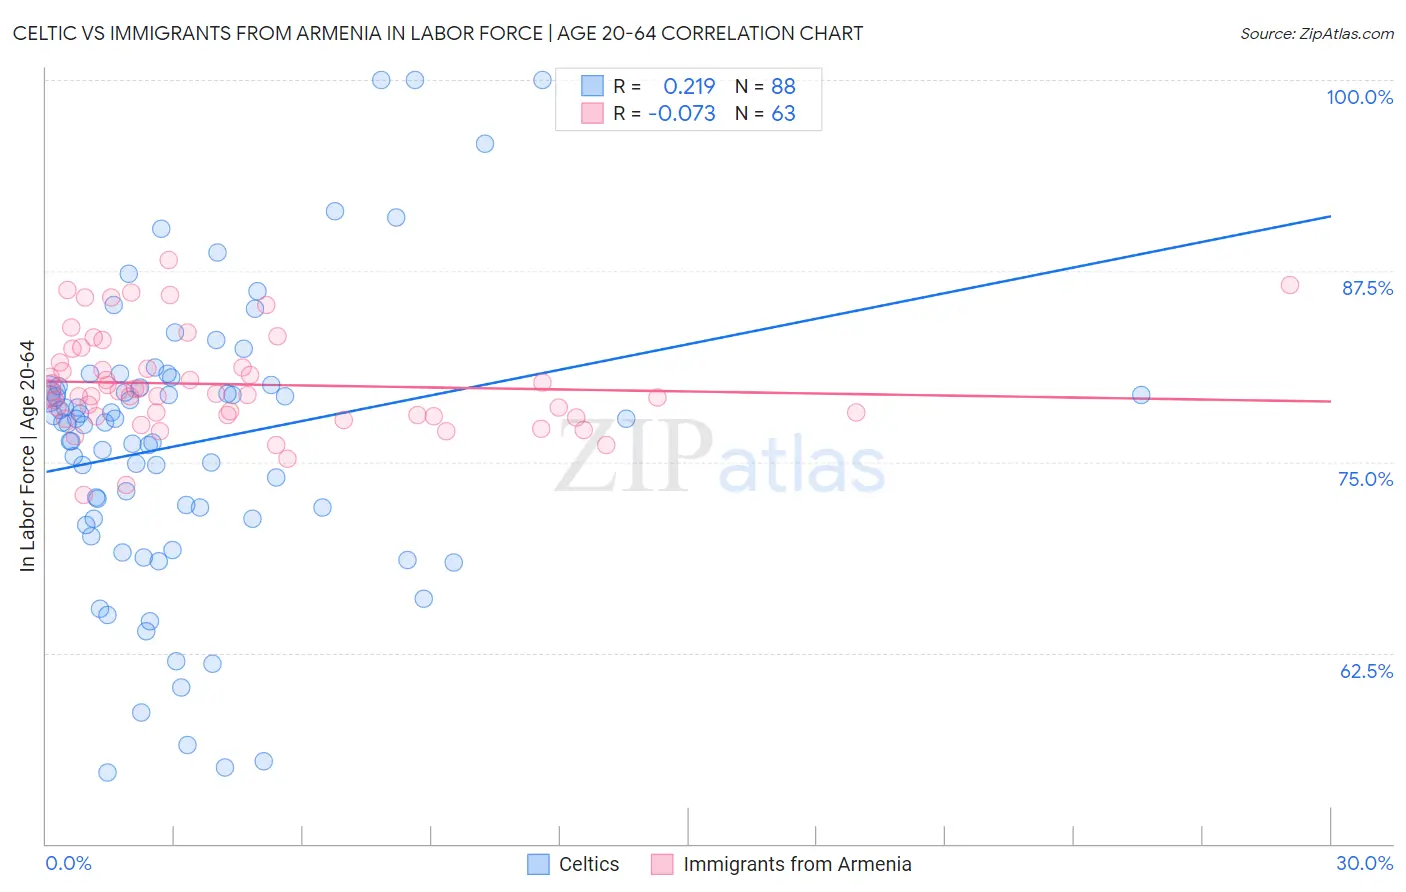
Celtic vs Immigrants from Armenia In Labor Force | Age 20-64 Correlation Chart
The statistical analysis conducted on geographies consisting of 168,869,465 people shows a weak positive correlation between the proportion of Celtics and labor force participation rate among population between the ages 20 and 64 in the United States with a correlation coefficient (R) of 0.219 and weighted average of 78.7%. Similarly, the statistical analysis conducted on geographies consisting of 97,718,343 people shows a slight negative correlation between the proportion of Immigrants from Armenia and labor force participation rate among population between the ages 20 and 64 in the United States with a correlation coefficient (R) of -0.073 and weighted average of 79.2%, a difference of 0.68%.
In Labor Force | Age 20-64 Correlation Summary
| Measurement | Celtic | Immigrants from Armenia |
| Minimum | 54.7% | 72.8% |
| Maximum | 100.0% | 88.2% |
| Range | 45.3% | 15.4% |
| Mean | 76.2% | 80.1% |
| Median | 77.6% | 79.5% |
| Interquartile 25% (IQ1) | 71.3% | 78.0% |
| Interquartile 75% (IQ3) | 79.9% | 81.5% |
| Interquartile Range (IQR) | 8.6% | 3.5% |
| Standard Deviation (Sample) | 9.3% | 3.2% |
| Standard Deviation (Population) | 9.3% | 3.2% |
Similar Demographics by In Labor Force | Age 20-64
Demographics Similar to Celtics by In Labor Force | Age 20-64
In terms of in labor force | age 20-64, the demographic groups most similar to Celtics are Hawaiian (78.7%, a difference of 0.0%), Basque (78.7%, a difference of 0.020%), Immigrants from Lebanon (78.7%, a difference of 0.020%), Guatemalan (78.7%, a difference of 0.020%), and Immigrants from Guatemala (78.7%, a difference of 0.020%).
| Demographics | Rating | Rank | In Labor Force | Age 20-64 |
| English | 0.9 /100 | #249 | Tragic 78.8% |
| Hondurans | 0.8 /100 | #250 | Tragic 78.8% |
| Barbadians | 0.7 /100 | #251 | Tragic 78.8% |
| Immigrants | Honduras | 0.6 /100 | #252 | Tragic 78.7% |
| Basques | 0.5 /100 | #253 | Tragic 78.7% |
| Immigrants | Lebanon | 0.5 /100 | #254 | Tragic 78.7% |
| Hawaiians | 0.5 /100 | #255 | Tragic 78.7% |
| Celtics | 0.5 /100 | #256 | Tragic 78.7% |
| Guatemalans | 0.4 /100 | #257 | Tragic 78.7% |
| Immigrants | Guatemala | 0.4 /100 | #258 | Tragic 78.7% |
| Tsimshian | 0.4 /100 | #259 | Tragic 78.7% |
| Immigrants | Fiji | 0.3 /100 | #260 | Tragic 78.6% |
| Whites/Caucasians | 0.2 /100 | #261 | Tragic 78.5% |
| Fijians | 0.1 /100 | #262 | Tragic 78.4% |
| Pennsylvania Germans | 0.1 /100 | #263 | Tragic 78.4% |
Demographics Similar to Immigrants from Armenia by In Labor Force | Age 20-64
In terms of in labor force | age 20-64, the demographic groups most similar to Immigrants from Armenia are Immigrants from Norway (79.2%, a difference of 0.0%), Immigrants from Portugal (79.3%, a difference of 0.010%), Arab (79.2%, a difference of 0.010%), Irish (79.3%, a difference of 0.020%), and Immigrants from Western Asia (79.2%, a difference of 0.020%).
| Demographics | Rating | Rank | In Labor Force | Age 20-64 |
| Sub-Saharan Africans | 16.5 /100 | #207 | Poor 79.3% |
| British | 16.5 /100 | #208 | Poor 79.3% |
| Bangladeshis | 16.4 /100 | #209 | Poor 79.3% |
| Haitians | 16.1 /100 | #210 | Poor 79.3% |
| Europeans | 15.3 /100 | #211 | Poor 79.3% |
| Irish | 13.2 /100 | #212 | Poor 79.3% |
| Immigrants | Portugal | 12.8 /100 | #213 | Poor 79.3% |
| Immigrants | Armenia | 12.2 /100 | #214 | Poor 79.2% |
| Immigrants | Norway | 12.0 /100 | #215 | Poor 79.2% |
| Arabs | 11.4 /100 | #216 | Poor 79.2% |
| Immigrants | Western Asia | 11.0 /100 | #217 | Poor 79.2% |
| Immigrants | England | 9.3 /100 | #218 | Tragic 79.2% |
| French Canadians | 8.4 /100 | #219 | Tragic 79.2% |
| Immigrants | Immigrants | 7.7 /100 | #220 | Tragic 79.2% |
| Hungarians | 7.2 /100 | #221 | Tragic 79.2% |