African vs Immigrants from Armenia Ambulatory Disability
COMPARE
African
Immigrants from Armenia
Ambulatory Disability
Ambulatory Disability Comparison
Africans
Immigrants from Armenia
7.0%
AMBULATORY DISABILITY
0.0/ 100
METRIC RATING
303rd/ 347
METRIC RANK
7.0%
AMBULATORY DISABILITY
0.0/ 100
METRIC RATING
302nd/ 347
METRIC RANK
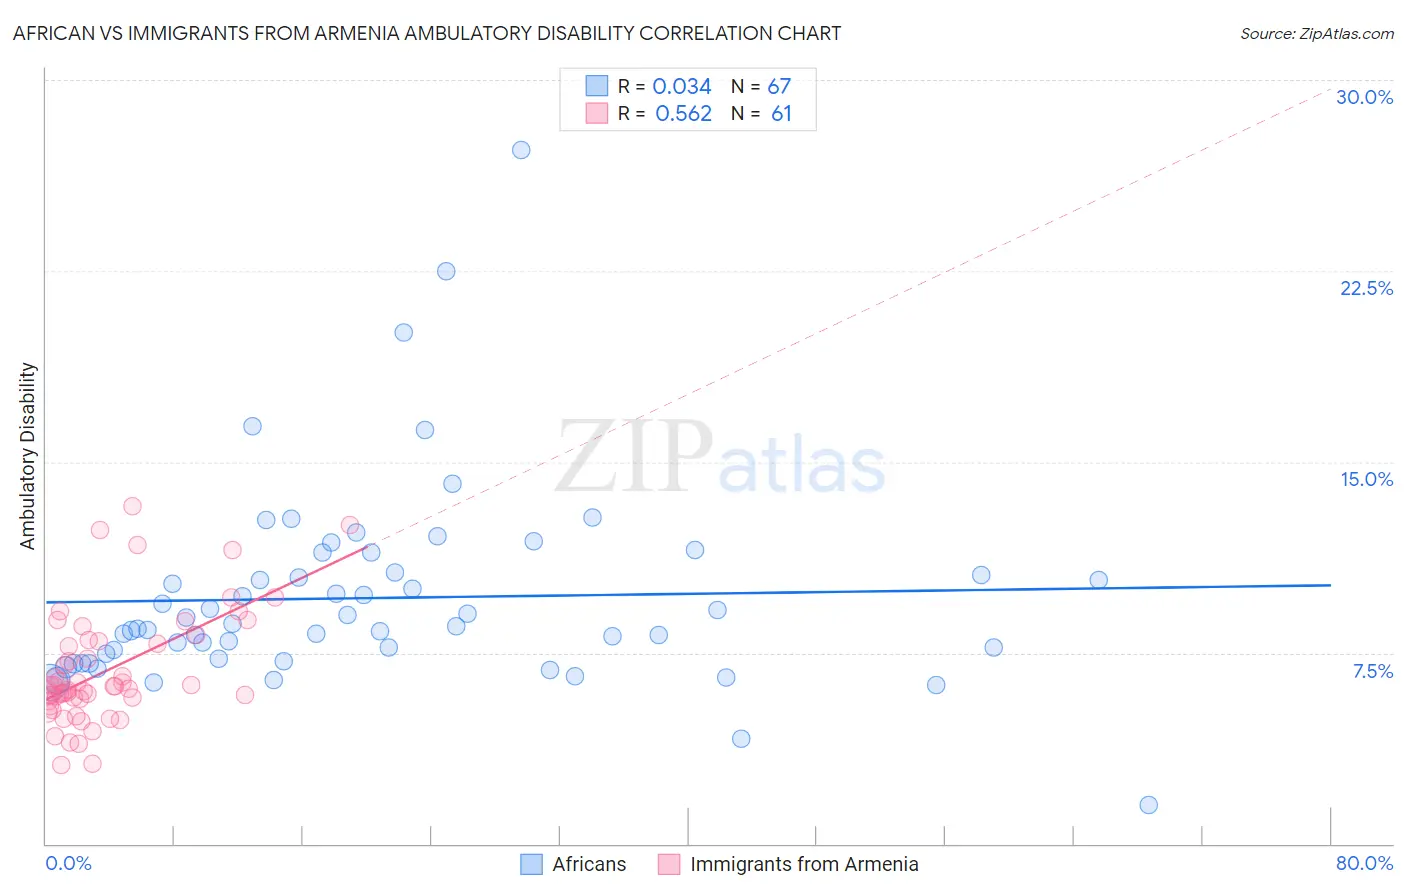
African vs Immigrants from Armenia Ambulatory Disability Correlation Chart
The statistical analysis conducted on geographies consisting of 469,824,822 people shows no correlation between the proportion of Africans and percentage of population with ambulatory disability in the United States with a correlation coefficient (R) of 0.034 and weighted average of 7.0%. Similarly, the statistical analysis conducted on geographies consisting of 97,709,765 people shows a substantial positive correlation between the proportion of Immigrants from Armenia and percentage of population with ambulatory disability in the United States with a correlation coefficient (R) of 0.562 and weighted average of 7.0%, a difference of 0.060%.
Ambulatory Disability Correlation Summary
| Measurement | African | Immigrants from Armenia |
| Minimum | 1.5% | 3.1% |
| Maximum | 27.3% | 13.3% |
| Range | 25.7% | 10.2% |
| Mean | 9.7% | 6.8% |
| Median | 8.6% | 6.2% |
| Interquartile 25% (IQ1) | 7.3% | 5.6% |
| Interquartile 75% (IQ3) | 10.6% | 8.0% |
| Interquartile Range (IQR) | 3.4% | 2.3% |
| Standard Deviation (Sample) | 3.9% | 2.2% |
| Standard Deviation (Population) | 3.9% | 2.2% |
Demographics Similar to Africans and Immigrants from Armenia by Ambulatory Disability
In terms of ambulatory disability, the demographic groups most similar to Africans are British West Indian (7.0%, a difference of 0.11%), Marshallese (6.9%, a difference of 0.34%), Puget Sound Salish (6.9%, a difference of 0.35%), Immigrants from Cabo Verde (7.0%, a difference of 0.36%), and French American Indian (6.9%, a difference of 0.49%). Similarly, the demographic groups most similar to Immigrants from Armenia are British West Indian (7.0%, a difference of 0.060%), Marshallese (6.9%, a difference of 0.28%), Puget Sound Salish (6.9%, a difference of 0.30%), Immigrants from Cabo Verde (7.0%, a difference of 0.42%), and Immigrants from Grenada (6.9%, a difference of 0.43%).
| Demographics | Rating | Rank | Ambulatory Disability |
| Cheyenne | 0.0 /100 | #292 | Tragic 6.9% |
| Immigrants | St. Vincent and the Grenadines | 0.0 /100 | #293 | Tragic 6.9% |
| Cape Verdeans | 0.0 /100 | #294 | Tragic 6.9% |
| Crow | 0.0 /100 | #295 | Tragic 6.9% |
| Alaskan Athabascans | 0.0 /100 | #296 | Tragic 6.9% |
| French American Indians | 0.0 /100 | #297 | Tragic 6.9% |
| Immigrants | Grenada | 0.0 /100 | #298 | Tragic 6.9% |
| Puget Sound Salish | 0.0 /100 | #299 | Tragic 6.9% |
| Marshallese | 0.0 /100 | #300 | Tragic 6.9% |
| British West Indians | 0.0 /100 | #301 | Tragic 7.0% |
| Immigrants | Armenia | 0.0 /100 | #302 | Tragic 7.0% |
| Africans | 0.0 /100 | #303 | Tragic 7.0% |
| Immigrants | Cabo Verde | 0.0 /100 | #304 | Tragic 7.0% |
| Immigrants | Micronesia | 0.0 /100 | #305 | Tragic 7.0% |
| Iroquois | 0.0 /100 | #306 | Tragic 7.1% |
| Spanish Americans | 0.0 /100 | #307 | Tragic 7.1% |
| Chippewa | 0.0 /100 | #308 | Tragic 7.1% |
| Immigrants | Azores | 0.0 /100 | #309 | Tragic 7.1% |
| Arapaho | 0.0 /100 | #310 | Tragic 7.1% |
| Cree | 0.0 /100 | #311 | Tragic 7.1% |
| Delaware | 0.0 /100 | #312 | Tragic 7.1% |