Pakistani vs Immigrants from Armenia Ambulatory Disability
COMPARE
Pakistani
Immigrants from Armenia
Ambulatory Disability
Ambulatory Disability Comparison
Pakistanis
Immigrants from Armenia
6.0%
AMBULATORY DISABILITY
82.5/ 100
METRIC RATING
145th/ 347
METRIC RANK
7.0%
AMBULATORY DISABILITY
0.0/ 100
METRIC RATING
302nd/ 347
METRIC RANK
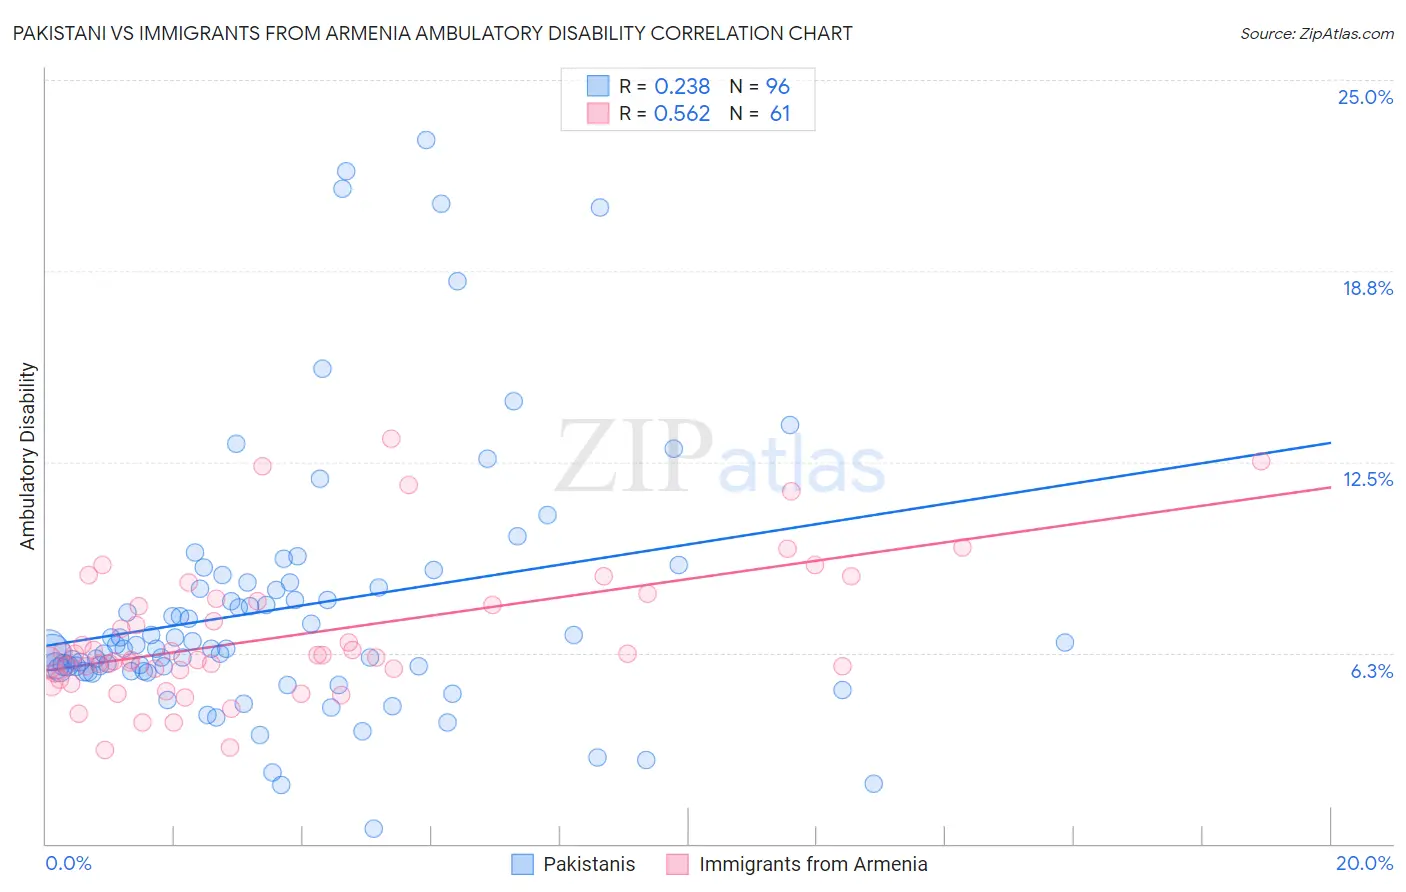
Pakistani vs Immigrants from Armenia Ambulatory Disability Correlation Chart
The statistical analysis conducted on geographies consisting of 335,239,652 people shows a weak positive correlation between the proportion of Pakistanis and percentage of population with ambulatory disability in the United States with a correlation coefficient (R) of 0.238 and weighted average of 6.0%. Similarly, the statistical analysis conducted on geographies consisting of 97,709,765 people shows a substantial positive correlation between the proportion of Immigrants from Armenia and percentage of population with ambulatory disability in the United States with a correlation coefficient (R) of 0.562 and weighted average of 7.0%, a difference of 16.3%.
Ambulatory Disability Correlation Summary
| Measurement | Pakistani | Immigrants from Armenia |
| Minimum | 0.47% | 3.1% |
| Maximum | 23.0% | 13.3% |
| Range | 22.6% | 10.2% |
| Mean | 7.7% | 6.8% |
| Median | 6.4% | 6.2% |
| Interquartile 25% (IQ1) | 5.6% | 5.6% |
| Interquartile 75% (IQ3) | 8.5% | 8.0% |
| Interquartile Range (IQR) | 2.8% | 2.3% |
| Standard Deviation (Sample) | 4.4% | 2.2% |
| Standard Deviation (Population) | 4.3% | 2.2% |
Similar Demographics by Ambulatory Disability
Demographics Similar to Pakistanis by Ambulatory Disability
In terms of ambulatory disability, the demographic groups most similar to Pakistanis are Immigrants from Greece (6.0%, a difference of 0.0%), Immigrants from Moldova (6.0%, a difference of 0.010%), Macedonian (6.0%, a difference of 0.030%), Romanian (6.0%, a difference of 0.040%), and Immigrants from Philippines (6.0%, a difference of 0.050%).
| Demographics | Rating | Rank | Ambulatory Disability |
| Immigrants | Hungary | 83.9 /100 | #138 | Excellent 6.0% |
| Immigrants | Zaire | 83.6 /100 | #139 | Excellent 6.0% |
| Czechs | 83.3 /100 | #140 | Excellent 6.0% |
| Swedes | 83.1 /100 | #141 | Excellent 6.0% |
| Immigrants | Philippines | 83.0 /100 | #142 | Excellent 6.0% |
| Romanians | 82.9 /100 | #143 | Excellent 6.0% |
| Macedonians | 82.8 /100 | #144 | Excellent 6.0% |
| Pakistanis | 82.5 /100 | #145 | Excellent 6.0% |
| Immigrants | Greece | 82.5 /100 | #146 | Excellent 6.0% |
| Immigrants | Moldova | 82.4 /100 | #147 | Excellent 6.0% |
| Immigrants | Eastern Europe | 82.0 /100 | #148 | Excellent 6.0% |
| Lithuanians | 81.9 /100 | #149 | Excellent 6.0% |
| Maltese | 81.6 /100 | #150 | Excellent 6.0% |
| Greeks | 79.6 /100 | #151 | Good 6.0% |
| Immigrants | Austria | 78.8 /100 | #152 | Good 6.0% |
Demographics Similar to Immigrants from Armenia by Ambulatory Disability
In terms of ambulatory disability, the demographic groups most similar to Immigrants from Armenia are British West Indian (7.0%, a difference of 0.060%), African (7.0%, a difference of 0.060%), Marshallese (6.9%, a difference of 0.28%), Puget Sound Salish (6.9%, a difference of 0.30%), and Immigrants from Cabo Verde (7.0%, a difference of 0.42%).
| Demographics | Rating | Rank | Ambulatory Disability |
| Crow | 0.0 /100 | #295 | Tragic 6.9% |
| Alaskan Athabascans | 0.0 /100 | #296 | Tragic 6.9% |
| French American Indians | 0.0 /100 | #297 | Tragic 6.9% |
| Immigrants | Grenada | 0.0 /100 | #298 | Tragic 6.9% |
| Puget Sound Salish | 0.0 /100 | #299 | Tragic 6.9% |
| Marshallese | 0.0 /100 | #300 | Tragic 6.9% |
| British West Indians | 0.0 /100 | #301 | Tragic 7.0% |
| Immigrants | Armenia | 0.0 /100 | #302 | Tragic 7.0% |
| Africans | 0.0 /100 | #303 | Tragic 7.0% |
| Immigrants | Cabo Verde | 0.0 /100 | #304 | Tragic 7.0% |
| Immigrants | Micronesia | 0.0 /100 | #305 | Tragic 7.0% |
| Iroquois | 0.0 /100 | #306 | Tragic 7.1% |
| Spanish Americans | 0.0 /100 | #307 | Tragic 7.1% |
| Chippewa | 0.0 /100 | #308 | Tragic 7.1% |
| Immigrants | Azores | 0.0 /100 | #309 | Tragic 7.1% |