Bulgarian vs Immigrants from Armenia Ambulatory Disability
COMPARE
Bulgarian
Immigrants from Armenia
Ambulatory Disability
Ambulatory Disability Comparison
Bulgarians
Immigrants from Armenia
5.6%
AMBULATORY DISABILITY
99.9/ 100
METRIC RATING
49th/ 347
METRIC RANK
7.0%
AMBULATORY DISABILITY
0.0/ 100
METRIC RATING
302nd/ 347
METRIC RANK
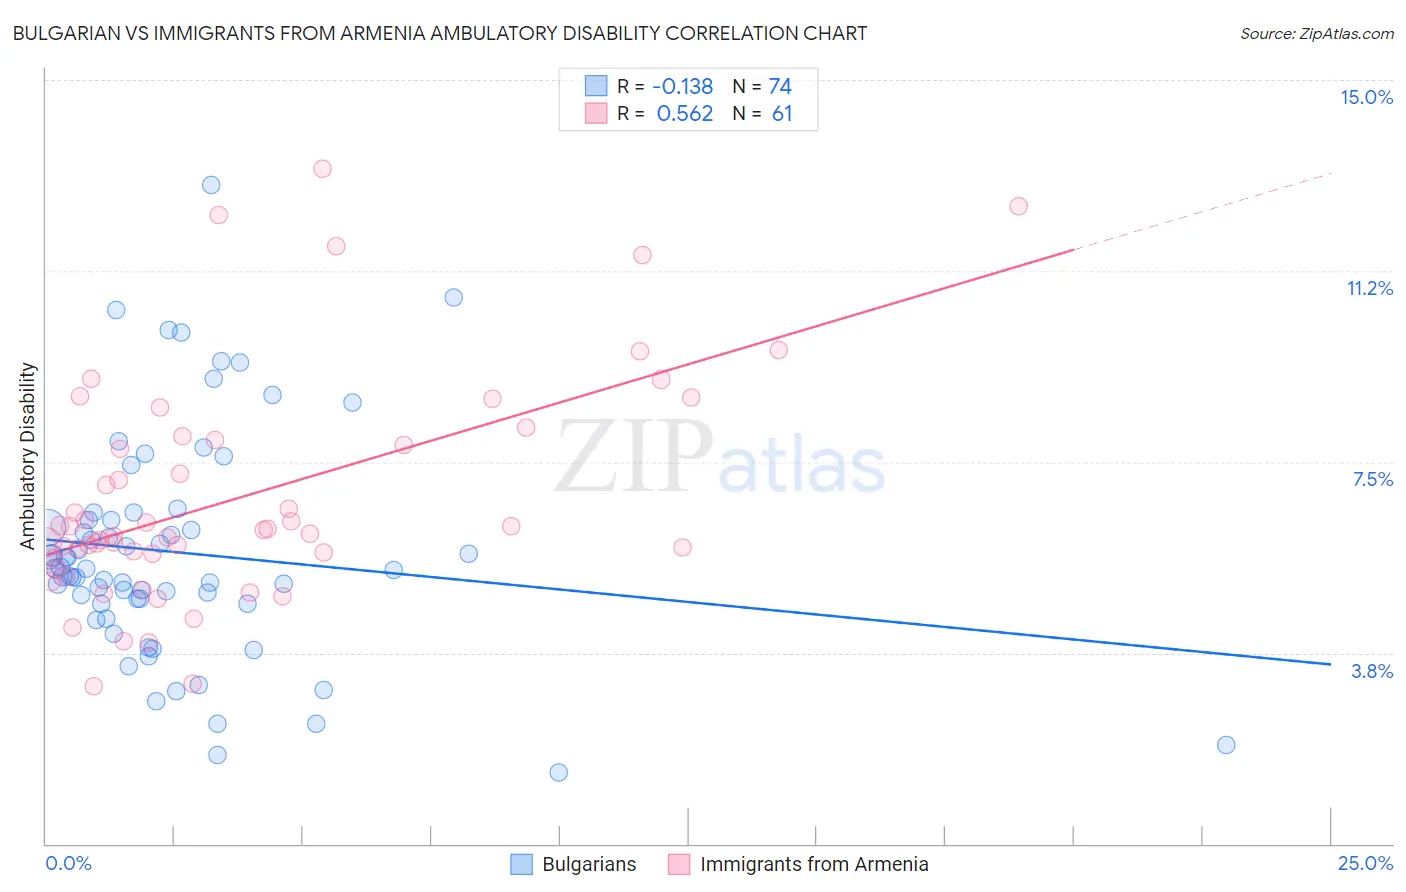
Bulgarian vs Immigrants from Armenia Ambulatory Disability Correlation Chart
The statistical analysis conducted on geographies consisting of 205,613,194 people shows a poor negative correlation between the proportion of Bulgarians and percentage of population with ambulatory disability in the United States with a correlation coefficient (R) of -0.138 and weighted average of 5.6%. Similarly, the statistical analysis conducted on geographies consisting of 97,709,765 people shows a substantial positive correlation between the proportion of Immigrants from Armenia and percentage of population with ambulatory disability in the United States with a correlation coefficient (R) of 0.562 and weighted average of 7.0%, a difference of 25.1%.
Ambulatory Disability Correlation Summary
| Measurement | Bulgarian | Immigrants from Armenia |
| Minimum | 1.4% | 3.1% |
| Maximum | 12.9% | 13.3% |
| Range | 11.6% | 10.2% |
| Mean | 5.7% | 6.8% |
| Median | 5.4% | 6.2% |
| Interquartile 25% (IQ1) | 4.7% | 5.6% |
| Interquartile 75% (IQ3) | 6.4% | 8.0% |
| Interquartile Range (IQR) | 1.6% | 2.3% |
| Standard Deviation (Sample) | 2.2% | 2.2% |
| Standard Deviation (Population) | 2.2% | 2.2% |
Similar Demographics by Ambulatory Disability
Demographics Similar to Bulgarians by Ambulatory Disability
In terms of ambulatory disability, the demographic groups most similar to Bulgarians are Immigrants from Argentina (5.6%, a difference of 0.19%), Egyptian (5.6%, a difference of 0.21%), Immigrants from Japan (5.6%, a difference of 0.21%), Immigrants from Sweden (5.6%, a difference of 0.22%), and Luxembourger (5.6%, a difference of 0.34%).
| Demographics | Rating | Rank | Ambulatory Disability |
| Argentineans | 99.9 /100 | #42 | Exceptional 5.5% |
| Paraguayans | 99.9 /100 | #43 | Exceptional 5.5% |
| Immigrants | Indonesia | 99.9 /100 | #44 | Exceptional 5.5% |
| Immigrants | Sweden | 99.9 /100 | #45 | Exceptional 5.6% |
| Egyptians | 99.9 /100 | #46 | Exceptional 5.6% |
| Immigrants | Japan | 99.9 /100 | #47 | Exceptional 5.6% |
| Immigrants | Argentina | 99.9 /100 | #48 | Exceptional 5.6% |
| Bulgarians | 99.9 /100 | #49 | Exceptional 5.6% |
| Luxembourgers | 99.9 /100 | #50 | Exceptional 5.6% |
| Taiwanese | 99.8 /100 | #51 | Exceptional 5.6% |
| Jordanians | 99.8 /100 | #52 | Exceptional 5.6% |
| Immigrants | Egypt | 99.8 /100 | #53 | Exceptional 5.6% |
| Immigrants | Eastern Africa | 99.8 /100 | #54 | Exceptional 5.6% |
| Immigrants | Bulgaria | 99.8 /100 | #55 | Exceptional 5.6% |
| Inupiat | 99.8 /100 | #56 | Exceptional 5.6% |
Demographics Similar to Immigrants from Armenia by Ambulatory Disability
In terms of ambulatory disability, the demographic groups most similar to Immigrants from Armenia are British West Indian (7.0%, a difference of 0.060%), African (7.0%, a difference of 0.060%), Marshallese (6.9%, a difference of 0.28%), Puget Sound Salish (6.9%, a difference of 0.30%), and Immigrants from Cabo Verde (7.0%, a difference of 0.42%).
| Demographics | Rating | Rank | Ambulatory Disability |
| Crow | 0.0 /100 | #295 | Tragic 6.9% |
| Alaskan Athabascans | 0.0 /100 | #296 | Tragic 6.9% |
| French American Indians | 0.0 /100 | #297 | Tragic 6.9% |
| Immigrants | Grenada | 0.0 /100 | #298 | Tragic 6.9% |
| Puget Sound Salish | 0.0 /100 | #299 | Tragic 6.9% |
| Marshallese | 0.0 /100 | #300 | Tragic 6.9% |
| British West Indians | 0.0 /100 | #301 | Tragic 7.0% |
| Immigrants | Armenia | 0.0 /100 | #302 | Tragic 7.0% |
| Africans | 0.0 /100 | #303 | Tragic 7.0% |
| Immigrants | Cabo Verde | 0.0 /100 | #304 | Tragic 7.0% |
| Immigrants | Micronesia | 0.0 /100 | #305 | Tragic 7.0% |
| Iroquois | 0.0 /100 | #306 | Tragic 7.1% |
| Spanish Americans | 0.0 /100 | #307 | Tragic 7.1% |
| Chippewa | 0.0 /100 | #308 | Tragic 7.1% |
| Immigrants | Azores | 0.0 /100 | #309 | Tragic 7.1% |