Immigrants from Nepal vs Czech Disability
COMPARE
Immigrants from Nepal
Czech
Disability
Disability Comparison
Immigrants from Nepal
Czechs
10.8%
DISABILITY
99.9/ 100
METRIC RATING
42nd/ 347
METRIC RANK
12.0%
DISABILITY
7.9/ 100
METRIC RATING
210th/ 347
METRIC RANK
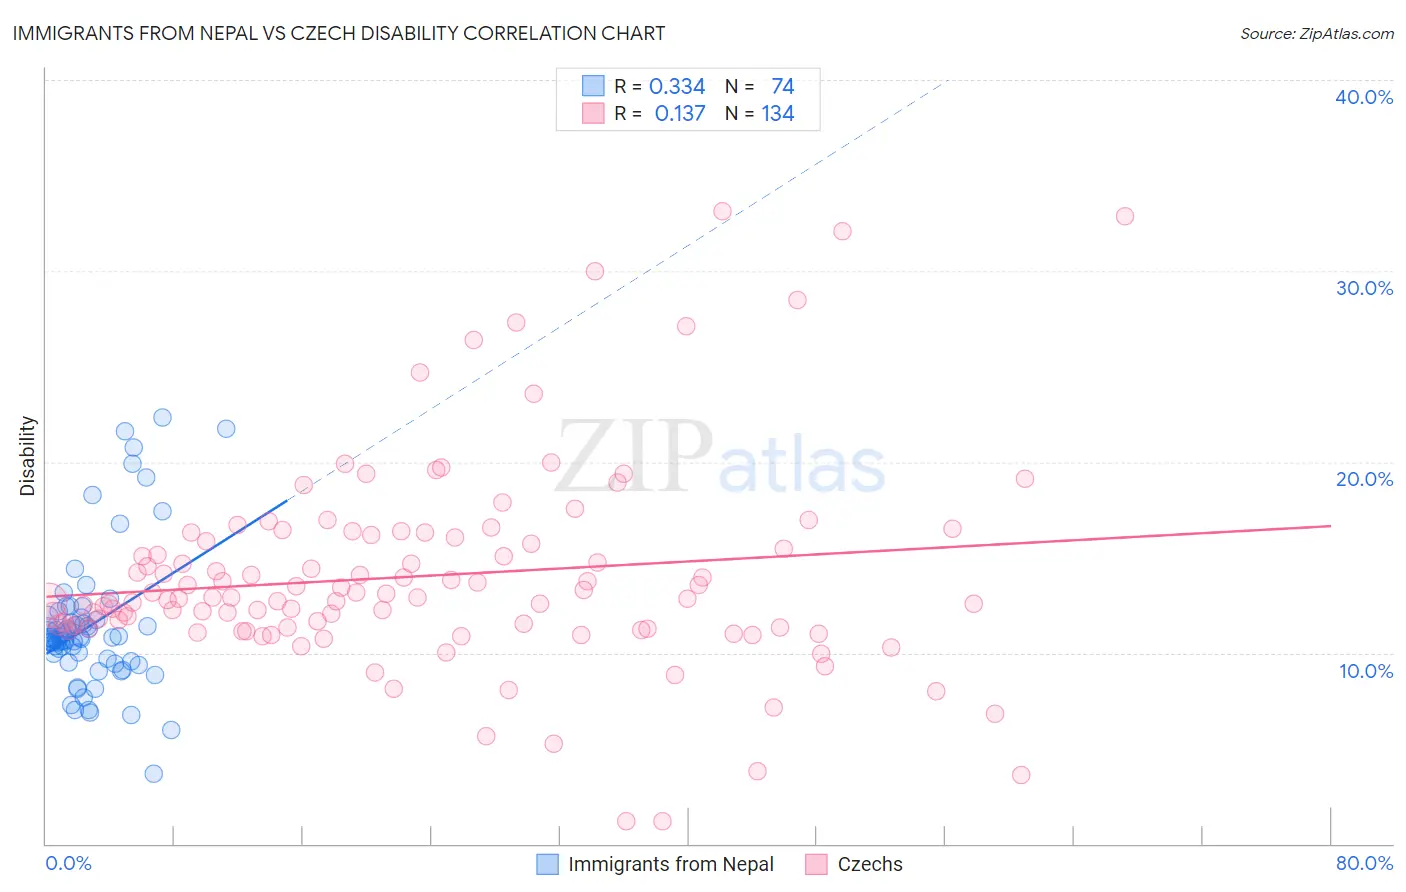
Immigrants from Nepal vs Czech Disability Correlation Chart
The statistical analysis conducted on geographies consisting of 186,790,977 people shows a mild positive correlation between the proportion of Immigrants from Nepal and percentage of population with a disability in the United States with a correlation coefficient (R) of 0.334 and weighted average of 10.8%. Similarly, the statistical analysis conducted on geographies consisting of 484,761,061 people shows a poor positive correlation between the proportion of Czechs and percentage of population with a disability in the United States with a correlation coefficient (R) of 0.137 and weighted average of 12.0%, a difference of 11.5%.
Disability Correlation Summary
| Measurement | Immigrants from Nepal | Czech |
| Minimum | 3.7% | 1.2% |
| Maximum | 22.3% | 33.1% |
| Range | 18.7% | 31.9% |
| Mean | 11.4% | 14.0% |
| Median | 10.8% | 12.9% |
| Interquartile 25% (IQ1) | 9.6% | 11.3% |
| Interquartile 75% (IQ3) | 11.9% | 16.0% |
| Interquartile Range (IQR) | 2.3% | 4.7% |
| Standard Deviation (Sample) | 3.7% | 5.4% |
| Standard Deviation (Population) | 3.6% | 5.4% |
Similar Demographics by Disability
Demographics Similar to Immigrants from Nepal by Disability
In terms of disability, the demographic groups most similar to Immigrants from Nepal are Israeli (10.8%, a difference of 0.050%), Immigrants from Australia (10.8%, a difference of 0.10%), Cambodian (10.8%, a difference of 0.14%), Mongolian (10.8%, a difference of 0.14%), and Immigrants from Japan (10.8%, a difference of 0.15%).
| Demographics | Rating | Rank | Disability |
| Immigrants | Indonesia | 100.0 /100 | #35 | Exceptional 10.7% |
| Ethiopians | 100.0 /100 | #36 | Exceptional 10.7% |
| Turks | 100.0 /100 | #37 | Exceptional 10.7% |
| Afghans | 99.9 /100 | #38 | Exceptional 10.8% |
| Cambodians | 99.9 /100 | #39 | Exceptional 10.8% |
| Mongolians | 99.9 /100 | #40 | Exceptional 10.8% |
| Immigrants | Australia | 99.9 /100 | #41 | Exceptional 10.8% |
| Immigrants | Nepal | 99.9 /100 | #42 | Exceptional 10.8% |
| Israelis | 99.9 /100 | #43 | Exceptional 10.8% |
| Immigrants | Japan | 99.9 /100 | #44 | Exceptional 10.8% |
| Immigrants | Peru | 99.9 /100 | #45 | Exceptional 10.8% |
| Tongans | 99.9 /100 | #46 | Exceptional 10.8% |
| Taiwanese | 99.9 /100 | #47 | Exceptional 10.8% |
| Soviet Union | 99.9 /100 | #48 | Exceptional 10.9% |
| Vietnamese | 99.9 /100 | #49 | Exceptional 10.9% |
Demographics Similar to Czechs by Disability
In terms of disability, the demographic groups most similar to Czechs are Immigrants from Cambodia (12.0%, a difference of 0.080%), Austrian (12.0%, a difference of 0.11%), Immigrants from Iraq (12.0%, a difference of 0.11%), Danish (12.0%, a difference of 0.13%), and Immigrants from Somalia (12.0%, a difference of 0.16%).
| Demographics | Rating | Rank | Disability |
| British West Indians | 11.5 /100 | #203 | Poor 12.0% |
| Mexican American Indians | 11.4 /100 | #204 | Poor 12.0% |
| Immigrants | Western Europe | 10.1 /100 | #205 | Poor 12.0% |
| Immigrants | Senegal | 9.4 /100 | #206 | Tragic 12.0% |
| Immigrants | Thailand | 9.3 /100 | #207 | Tragic 12.0% |
| Immigrants | Caribbean | 9.1 /100 | #208 | Tragic 12.0% |
| Danes | 8.7 /100 | #209 | Tragic 12.0% |
| Czechs | 7.9 /100 | #210 | Tragic 12.0% |
| Immigrants | Cambodia | 7.3 /100 | #211 | Tragic 12.0% |
| Austrians | 7.2 /100 | #212 | Tragic 12.0% |
| Immigrants | Iraq | 7.1 /100 | #213 | Tragic 12.0% |
| Immigrants | Somalia | 6.8 /100 | #214 | Tragic 12.0% |
| Immigrants | Canada | 6.1 /100 | #215 | Tragic 12.1% |
| Panamanians | 5.4 /100 | #216 | Tragic 12.1% |
| Immigrants | North America | 5.3 /100 | #217 | Tragic 12.1% |