Lithuanian vs Czech Disability
COMPARE
Lithuanian
Czech
Disability
Disability Comparison
Lithuanians
Czechs
11.9%
DISABILITY
18.8/ 100
METRIC RATING
192nd/ 347
METRIC RANK
12.0%
DISABILITY
7.9/ 100
METRIC RATING
210th/ 347
METRIC RANK
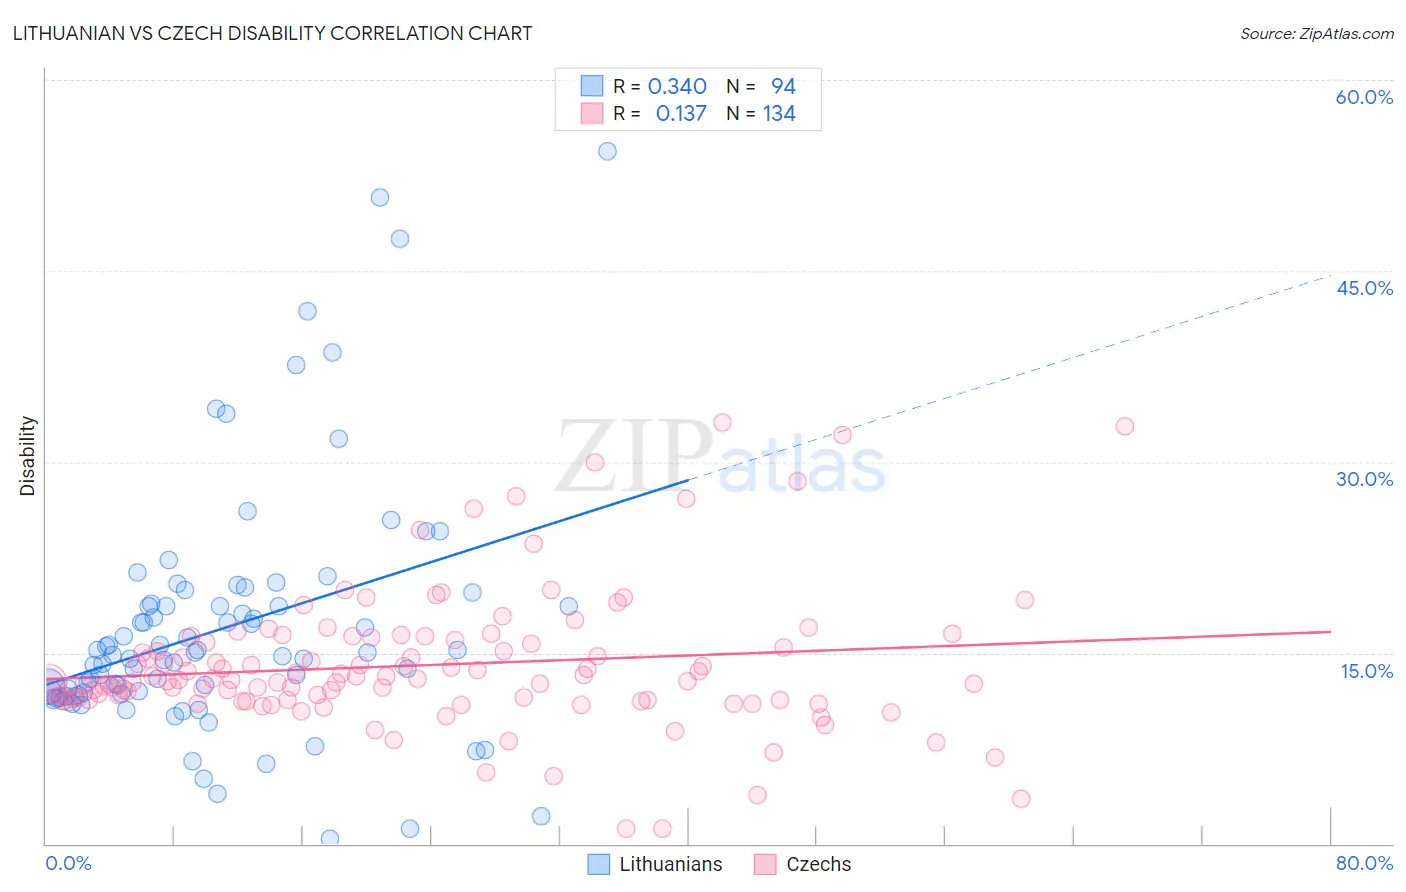
Lithuanian vs Czech Disability Correlation Chart
The statistical analysis conducted on geographies consisting of 421,948,731 people shows a mild positive correlation between the proportion of Lithuanians and percentage of population with a disability in the United States with a correlation coefficient (R) of 0.340 and weighted average of 11.9%. Similarly, the statistical analysis conducted on geographies consisting of 484,761,061 people shows a poor positive correlation between the proportion of Czechs and percentage of population with a disability in the United States with a correlation coefficient (R) of 0.137 and weighted average of 12.0%, a difference of 1.1%.
Disability Correlation Summary
| Measurement | Lithuanian | Czech |
| Minimum | 0.40% | 1.2% |
| Maximum | 54.4% | 33.1% |
| Range | 54.0% | 31.9% |
| Mean | 16.8% | 14.0% |
| Median | 14.8% | 12.9% |
| Interquartile 25% (IQ1) | 11.7% | 11.3% |
| Interquartile 75% (IQ3) | 18.7% | 16.0% |
| Interquartile Range (IQR) | 7.0% | 4.7% |
| Standard Deviation (Sample) | 9.6% | 5.4% |
| Standard Deviation (Population) | 9.6% | 5.4% |
Demographics Similar to Lithuanians and Czechs by Disability
In terms of disability, the demographic groups most similar to Lithuanians are Ute (11.9%, a difference of 0.050%), Immigrants from Bosnia and Herzegovina (11.9%, a difference of 0.050%), Somali (11.9%, a difference of 0.11%), Barbadian (11.9%, a difference of 0.22%), and Serbian (11.9%, a difference of 0.26%). Similarly, the demographic groups most similar to Czechs are Immigrants from Cambodia (12.0%, a difference of 0.080%), Danish (12.0%, a difference of 0.13%), Immigrants from Caribbean (12.0%, a difference of 0.17%), Immigrants from Thailand (12.0%, a difference of 0.19%), and Immigrants from Senegal (12.0%, a difference of 0.21%).
| Demographics | Rating | Rank | Disability |
| Ute | 19.5 /100 | #191 | Poor 11.9% |
| Lithuanians | 18.8 /100 | #192 | Poor 11.9% |
| Immigrants | Bosnia and Herzegovina | 18.0 /100 | #193 | Poor 11.9% |
| Somalis | 17.3 /100 | #194 | Poor 11.9% |
| Barbadians | 15.8 /100 | #195 | Poor 11.9% |
| Serbians | 15.4 /100 | #196 | Poor 11.9% |
| Immigrants | Belize | 15.2 /100 | #197 | Poor 11.9% |
| Ukrainians | 14.7 /100 | #198 | Poor 11.9% |
| Immigrants | Panama | 14.6 /100 | #199 | Poor 11.9% |
| Belizeans | 12.8 /100 | #200 | Poor 11.9% |
| Assyrians/Chaldeans/Syriacs | 12.6 /100 | #201 | Poor 11.9% |
| Immigrants | England | 12.0 /100 | #202 | Poor 12.0% |
| British West Indians | 11.5 /100 | #203 | Poor 12.0% |
| Mexican American Indians | 11.4 /100 | #204 | Poor 12.0% |
| Immigrants | Western Europe | 10.1 /100 | #205 | Poor 12.0% |
| Immigrants | Senegal | 9.4 /100 | #206 | Tragic 12.0% |
| Immigrants | Thailand | 9.3 /100 | #207 | Tragic 12.0% |
| Immigrants | Caribbean | 9.1 /100 | #208 | Tragic 12.0% |
| Danes | 8.7 /100 | #209 | Tragic 12.0% |
| Czechs | 7.9 /100 | #210 | Tragic 12.0% |
| Immigrants | Cambodia | 7.3 /100 | #211 | Tragic 12.0% |