Canadian vs Immigrants from Trinidad and Tobago Child Poverty Among Boys Under 16
COMPARE
Canadian
Immigrants from Trinidad and Tobago
Child Poverty Among Boys Under 16
Child Poverty Among Boys Under 16 Comparison
Canadians
Immigrants from Trinidad and Tobago
15.4%
CHILD POVERTY AMONG BOYS UNDER 16
90.6/ 100
METRIC RATING
128th/ 347
METRIC RANK
19.0%
CHILD POVERTY AMONG BOYS UNDER 16
0.3/ 100
METRIC RATING
247th/ 347
METRIC RANK
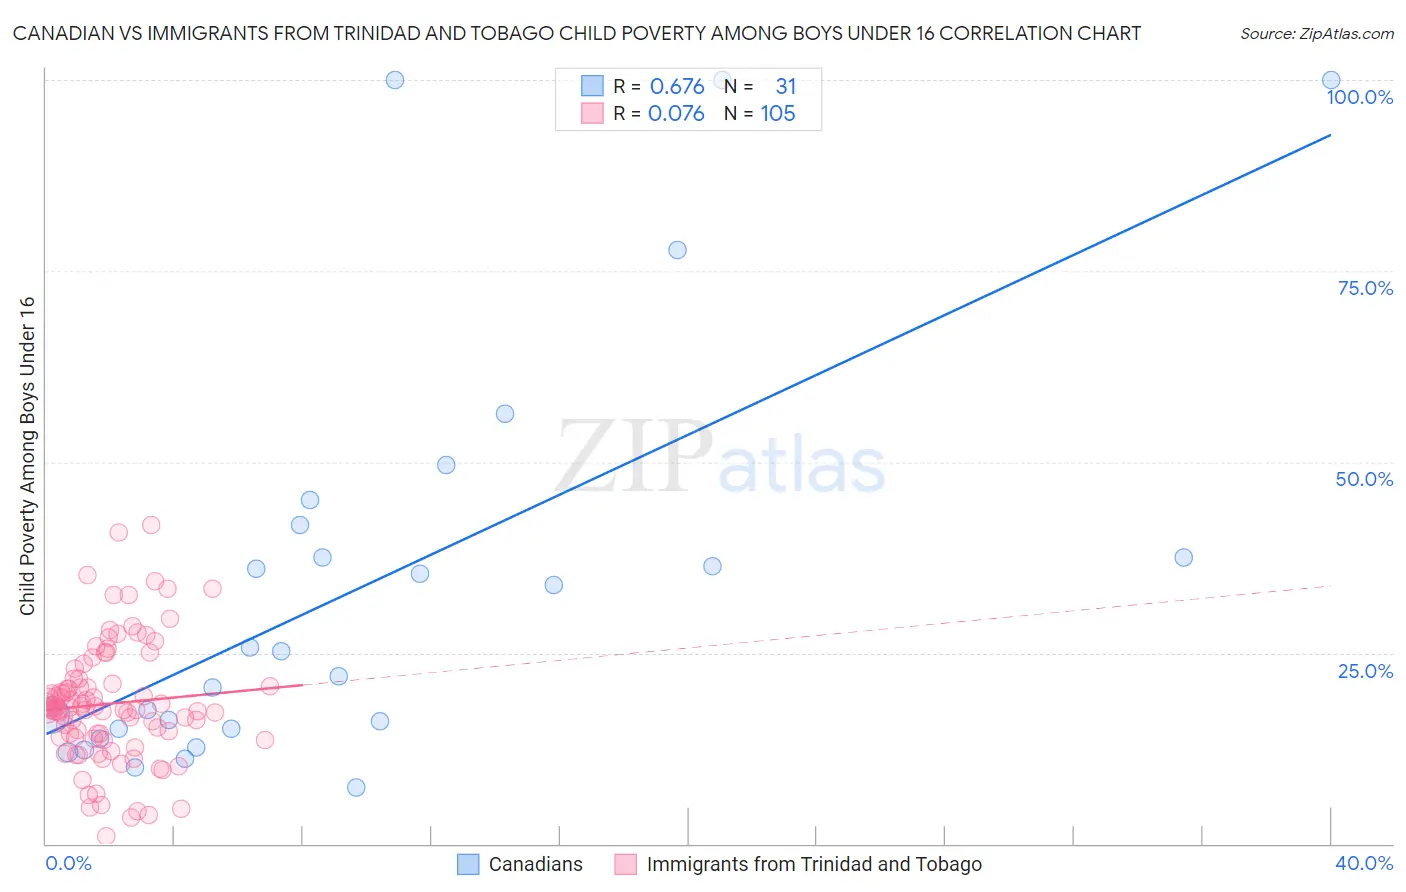
Canadian vs Immigrants from Trinidad and Tobago Child Poverty Among Boys Under 16 Correlation Chart
The statistical analysis conducted on geographies consisting of 427,690,103 people shows a significant positive correlation between the proportion of Canadians and poverty level among boys under the age of 16 in the United States with a correlation coefficient (R) of 0.676 and weighted average of 15.4%. Similarly, the statistical analysis conducted on geographies consisting of 221,543,811 people shows a slight positive correlation between the proportion of Immigrants from Trinidad and Tobago and poverty level among boys under the age of 16 in the United States with a correlation coefficient (R) of 0.076 and weighted average of 19.0%, a difference of 23.6%.
Child Poverty Among Boys Under 16 Correlation Summary
| Measurement | Canadian | Immigrants from Trinidad and Tobago |
| Minimum | 7.3% | 0.94% |
| Maximum | 100.0% | 41.7% |
| Range | 92.7% | 40.8% |
| Mean | 34.1% | 18.3% |
| Median | 25.1% | 17.7% |
| Interquartile 25% (IQ1) | 15.0% | 14.0% |
| Interquartile 75% (IQ3) | 41.7% | 21.2% |
| Interquartile Range (IQR) | 26.7% | 7.2% |
| Standard Deviation (Sample) | 27.1% | 7.8% |
| Standard Deviation (Population) | 26.6% | 7.7% |
Similar Demographics by Child Poverty Among Boys Under 16
Demographics Similar to Canadians by Child Poverty Among Boys Under 16
In terms of child poverty among boys under 16, the demographic groups most similar to Canadians are Immigrants from Brazil (15.4%, a difference of 0.12%), Mongolian (15.4%, a difference of 0.14%), Carpatho Rusyn (15.4%, a difference of 0.19%), Immigrants from Western Europe (15.4%, a difference of 0.20%), and Palestinian (15.4%, a difference of 0.24%).
| Demographics | Rating | Rank | Child Poverty Among Boys Under 16 |
| Scottish | 93.0 /100 | #121 | Exceptional 15.2% |
| Immigrants | Malaysia | 92.8 /100 | #122 | Exceptional 15.3% |
| Immigrants | Norway | 92.3 /100 | #123 | Exceptional 15.3% |
| Tlingit-Haida | 92.2 /100 | #124 | Exceptional 15.3% |
| Czechoslovakians | 92.1 /100 | #125 | Exceptional 15.3% |
| Palestinians | 91.3 /100 | #126 | Exceptional 15.4% |
| Carpatho Rusyns | 91.1 /100 | #127 | Exceptional 15.4% |
| Canadians | 90.6 /100 | #128 | Exceptional 15.4% |
| Immigrants | Brazil | 90.3 /100 | #129 | Exceptional 15.4% |
| Mongolians | 90.2 /100 | #130 | Exceptional 15.4% |
| Immigrants | Western Europe | 90.0 /100 | #131 | Exceptional 15.4% |
| Immigrants | Kazakhstan | 88.7 /100 | #132 | Excellent 15.5% |
| Welsh | 88.3 /100 | #133 | Excellent 15.5% |
| Peruvians | 88.1 /100 | #134 | Excellent 15.5% |
| Portuguese | 87.5 /100 | #135 | Excellent 15.5% |
Demographics Similar to Immigrants from Trinidad and Tobago by Child Poverty Among Boys Under 16
In terms of child poverty among boys under 16, the demographic groups most similar to Immigrants from Trinidad and Tobago are Salvadoran (19.0%, a difference of 0.080%), Immigrants from Nicaragua (19.0%, a difference of 0.12%), Alsatian (19.1%, a difference of 0.25%), Cree (19.0%, a difference of 0.32%), and Immigrants from Middle Africa (18.9%, a difference of 0.45%).
| Demographics | Rating | Rank | Child Poverty Among Boys Under 16 |
| Immigrants | Cuba | 0.6 /100 | #240 | Tragic 18.8% |
| Immigrants | Sudan | 0.6 /100 | #241 | Tragic 18.8% |
| Ghanaians | 0.5 /100 | #242 | Tragic 18.9% |
| Immigrants | Azores | 0.4 /100 | #243 | Tragic 18.9% |
| Immigrants | Middle Africa | 0.4 /100 | #244 | Tragic 18.9% |
| Cree | 0.4 /100 | #245 | Tragic 19.0% |
| Immigrants | Nicaragua | 0.4 /100 | #246 | Tragic 19.0% |
| Immigrants | Trinidad and Tobago | 0.3 /100 | #247 | Tragic 19.0% |
| Salvadorans | 0.3 /100 | #248 | Tragic 19.0% |
| Alsatians | 0.3 /100 | #249 | Tragic 19.1% |
| Immigrants | Burma/Myanmar | 0.2 /100 | #250 | Tragic 19.2% |
| French American Indians | 0.2 /100 | #251 | Tragic 19.2% |
| Immigrants | Western Africa | 0.2 /100 | #252 | Tragic 19.3% |
| Liberians | 0.2 /100 | #253 | Tragic 19.3% |
| Trinidadians and Tobagonians | 0.2 /100 | #254 | Tragic 19.3% |