Venezuelan vs Immigrants from Trinidad and Tobago Disability Age 5 to 17
COMPARE
Venezuelan
Immigrants from Trinidad and Tobago
Disability Age 5 to 17
Disability Age 5 to 17 Comparison
Venezuelans
Immigrants from Trinidad and Tobago
5.4%
DISABILITY AGE 5 TO 17
92.7/ 100
METRIC RATING
133rd/ 347
METRIC RANK
5.6%
DISABILITY AGE 5 TO 17
47.6/ 100
METRIC RATING
178th/ 347
METRIC RANK
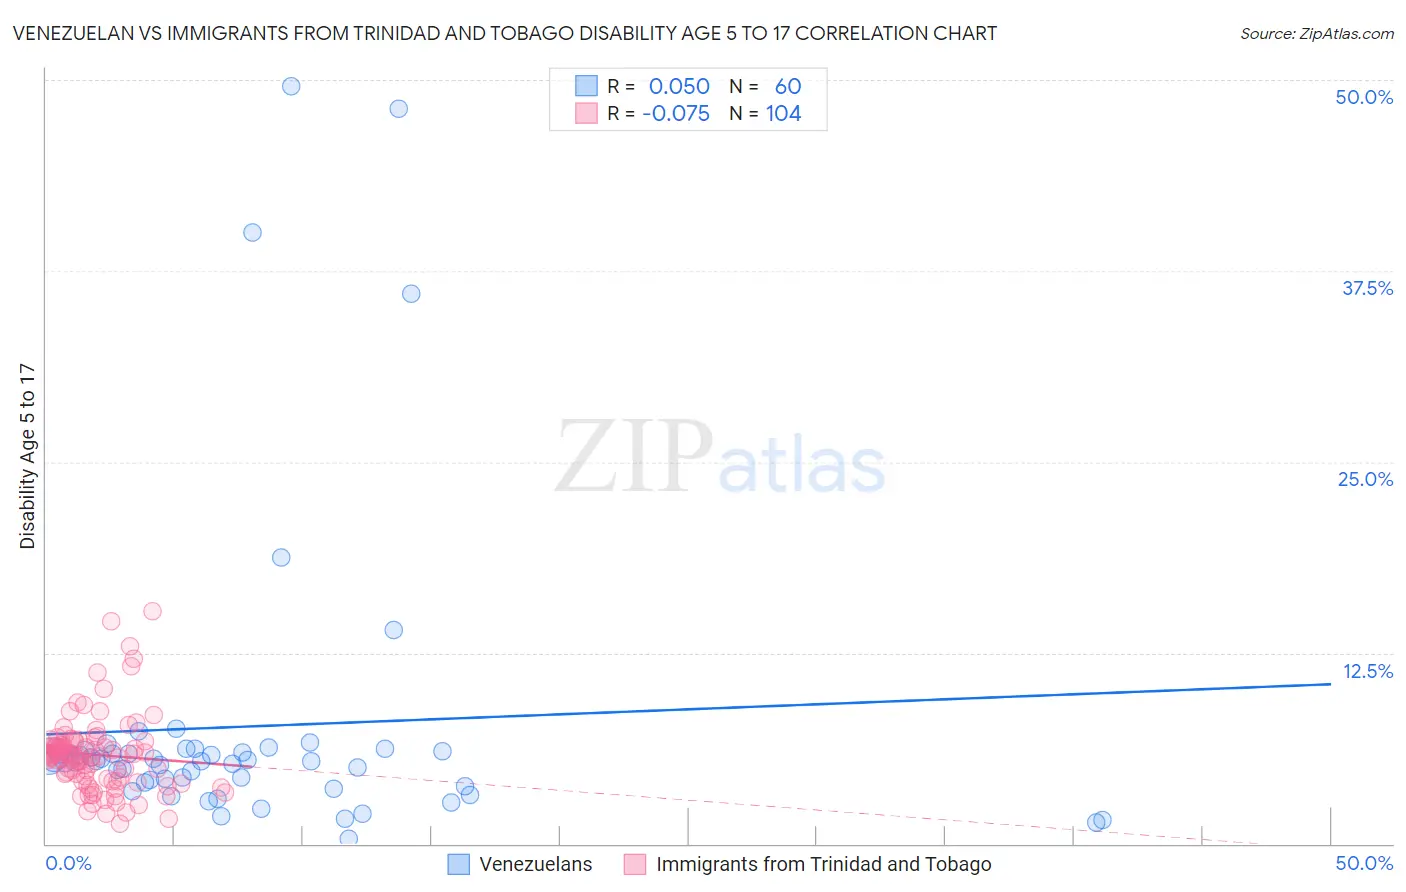
Venezuelan vs Immigrants from Trinidad and Tobago Disability Age 5 to 17 Correlation Chart
The statistical analysis conducted on geographies consisting of 304,670,804 people shows no correlation between the proportion of Venezuelans and percentage of population with a disability between the ages 5 and 17 in the United States with a correlation coefficient (R) of 0.050 and weighted average of 5.4%. Similarly, the statistical analysis conducted on geographies consisting of 222,636,548 people shows a slight negative correlation between the proportion of Immigrants from Trinidad and Tobago and percentage of population with a disability between the ages 5 and 17 in the United States with a correlation coefficient (R) of -0.075 and weighted average of 5.6%, a difference of 3.4%.
Disability Age 5 to 17 Correlation Summary
| Measurement | Venezuelan | Immigrants from Trinidad and Tobago |
| Minimum | 0.36% | 1.3% |
| Maximum | 49.6% | 15.2% |
| Range | 49.2% | 13.9% |
| Mean | 7.7% | 5.8% |
| Median | 5.4% | 5.8% |
| Interquartile 25% (IQ1) | 3.9% | 4.2% |
| Interquartile 75% (IQ3) | 6.1% | 6.6% |
| Interquartile Range (IQR) | 2.2% | 2.4% |
| Standard Deviation (Sample) | 10.1% | 2.5% |
| Standard Deviation (Population) | 10.0% | 2.5% |
Similar Demographics by Disability Age 5 to 17
Demographics Similar to Venezuelans by Disability Age 5 to 17
In terms of disability age 5 to 17, the demographic groups most similar to Venezuelans are Immigrants from Colombia (5.4%, a difference of 0.030%), Arab (5.4%, a difference of 0.050%), Yuman (5.4%, a difference of 0.080%), Immigrants from Belize (5.4%, a difference of 0.17%), and Immigrants from Denmark (5.4%, a difference of 0.22%).
| Demographics | Rating | Rank | Disability Age 5 to 17 |
| New Zealanders | 95.0 /100 | #126 | Exceptional 5.4% |
| Latvians | 95.0 /100 | #127 | Exceptional 5.4% |
| Immigrants | Venezuela | 94.5 /100 | #128 | Exceptional 5.4% |
| Romanians | 94.1 /100 | #129 | Exceptional 5.4% |
| Immigrants | Bulgaria | 94.0 /100 | #130 | Exceptional 5.4% |
| Arabs | 92.9 /100 | #131 | Exceptional 5.4% |
| Immigrants | Colombia | 92.9 /100 | #132 | Exceptional 5.4% |
| Venezuelans | 92.7 /100 | #133 | Exceptional 5.4% |
| Yuman | 92.3 /100 | #134 | Exceptional 5.4% |
| Immigrants | Belize | 91.7 /100 | #135 | Exceptional 5.4% |
| Immigrants | Denmark | 91.4 /100 | #136 | Exceptional 5.4% |
| Navajo | 90.9 /100 | #137 | Exceptional 5.4% |
| Immigrants | Oceania | 90.8 /100 | #138 | Exceptional 5.4% |
| Belizeans | 90.8 /100 | #139 | Exceptional 5.4% |
| Immigrants | Netherlands | 90.5 /100 | #140 | Exceptional 5.4% |
Demographics Similar to Immigrants from Trinidad and Tobago by Disability Age 5 to 17
In terms of disability age 5 to 17, the demographic groups most similar to Immigrants from Trinidad and Tobago are Immigrants from Western Europe (5.6%, a difference of 0.010%), Shoshone (5.6%, a difference of 0.090%), Immigrants from Central America (5.6%, a difference of 0.090%), Costa Rican (5.6%, a difference of 0.12%), and Uruguayan (5.6%, a difference of 0.17%).
| Demographics | Rating | Rank | Disability Age 5 to 17 |
| Immigrants | Iraq | 53.9 /100 | #171 | Average 5.6% |
| Ukrainians | 51.5 /100 | #172 | Average 5.6% |
| Uruguayans | 51.0 /100 | #173 | Average 5.6% |
| Costa Ricans | 50.0 /100 | #174 | Average 5.6% |
| Shoshone | 49.4 /100 | #175 | Average 5.6% |
| Immigrants | Central America | 49.4 /100 | #176 | Average 5.6% |
| Immigrants | Western Europe | 47.8 /100 | #177 | Average 5.6% |
| Immigrants | Trinidad and Tobago | 47.6 /100 | #178 | Average 5.6% |
| Immigrants | Barbados | 40.5 /100 | #179 | Average 5.6% |
| Immigrants | Uruguay | 37.7 /100 | #180 | Fair 5.6% |
| Immigrants | England | 36.4 /100 | #181 | Fair 5.6% |
| Mexican American Indians | 35.2 /100 | #182 | Fair 5.6% |
| Immigrants | Latin America | 34.3 /100 | #183 | Fair 5.6% |
| Syrians | 33.8 /100 | #184 | Fair 5.6% |
| Immigrants | Mexico | 33.7 /100 | #185 | Fair 5.6% |