Immigrants from Eastern Africa vs Northern European Disability
COMPARE
Immigrants from Eastern Africa
Northern European
Disability
Disability Comparison
Immigrants from Eastern Africa
Northern Europeans
11.3%
DISABILITY
96.7/ 100
METRIC RATING
102nd/ 347
METRIC RANK
12.1%
DISABILITY
4.2/ 100
METRIC RATING
221st/ 347
METRIC RANK
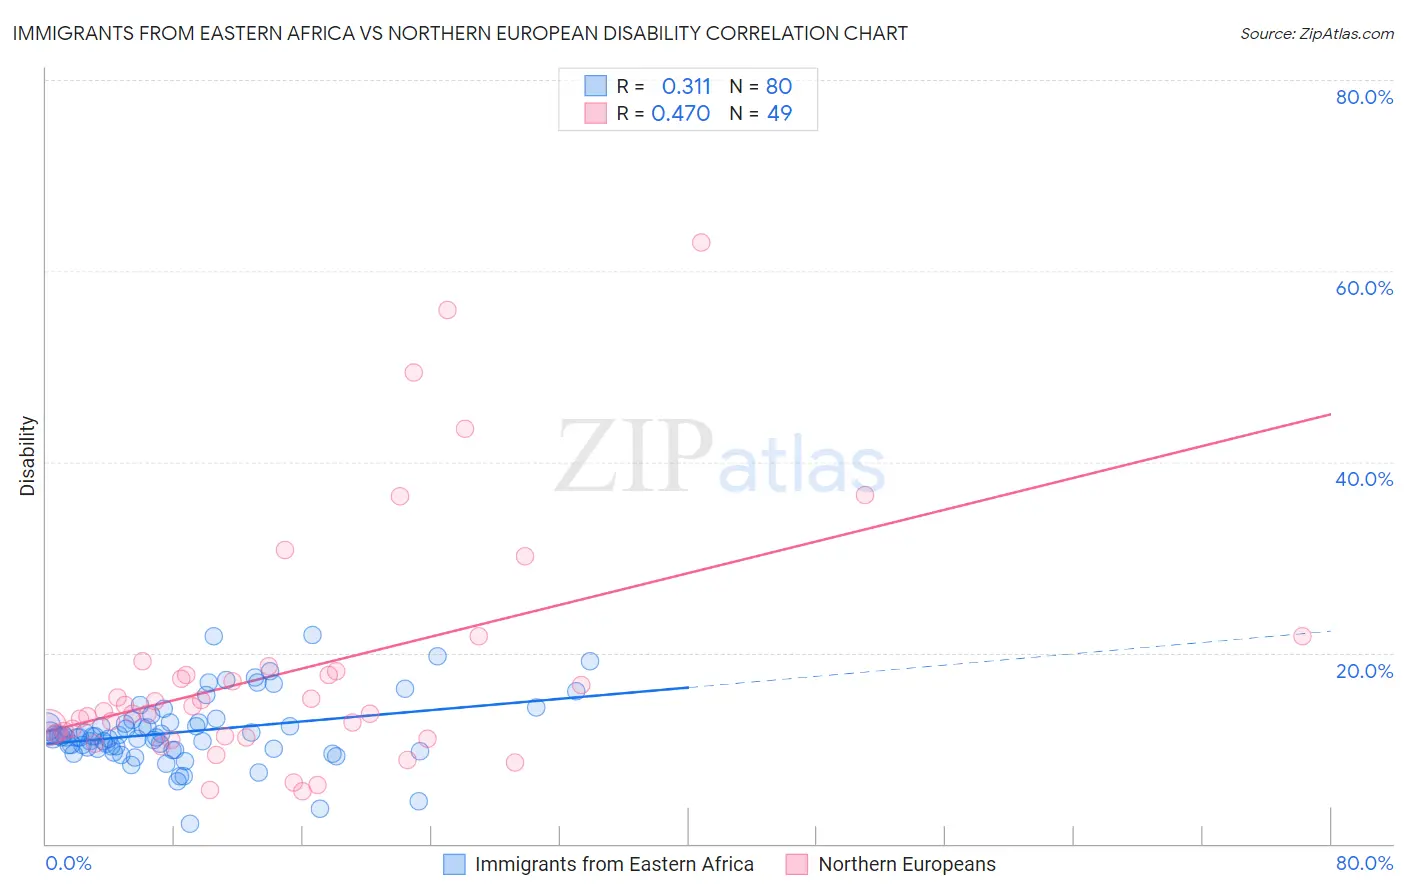
Immigrants from Eastern Africa vs Northern European Disability Correlation Chart
The statistical analysis conducted on geographies consisting of 355,125,072 people shows a mild positive correlation between the proportion of Immigrants from Eastern Africa and percentage of population with a disability in the United States with a correlation coefficient (R) of 0.311 and weighted average of 11.3%. Similarly, the statistical analysis conducted on geographies consisting of 406,050,412 people shows a moderate positive correlation between the proportion of Northern Europeans and percentage of population with a disability in the United States with a correlation coefficient (R) of 0.470 and weighted average of 12.1%, a difference of 7.5%.
Disability Correlation Summary
| Measurement | Immigrants from Eastern Africa | Northern European |
| Minimum | 2.1% | 5.4% |
| Maximum | 21.8% | 63.0% |
| Range | 19.7% | 57.5% |
| Mean | 11.7% | 18.2% |
| Median | 11.2% | 13.8% |
| Interquartile 25% (IQ1) | 10.0% | 11.2% |
| Interquartile 75% (IQ3) | 12.7% | 18.3% |
| Interquartile Range (IQR) | 2.7% | 7.1% |
| Standard Deviation (Sample) | 3.5% | 12.6% |
| Standard Deviation (Population) | 3.5% | 12.5% |
Similar Demographics by Disability
Demographics Similar to Immigrants from Eastern Africa by Disability
In terms of disability, the demographic groups most similar to Immigrants from Eastern Africa are Immigrants from Nicaragua (11.3%, a difference of 0.060%), Immigrants from Uruguay (11.3%, a difference of 0.070%), Immigrants (11.3%, a difference of 0.080%), Immigrants from Kazakhstan (11.3%, a difference of 0.090%), and Immigrants from Greece (11.3%, a difference of 0.11%).
| Demographics | Rating | Rank | Disability |
| Eastern Europeans | 97.8 /100 | #95 | Exceptional 11.2% |
| Immigrants | Zimbabwe | 97.7 /100 | #96 | Exceptional 11.2% |
| Bhutanese | 97.4 /100 | #97 | Exceptional 11.2% |
| Uruguayans | 97.4 /100 | #98 | Exceptional 11.2% |
| Immigrants | Czechoslovakia | 97.4 /100 | #99 | Exceptional 11.2% |
| Immigrants | Greece | 96.9 /100 | #100 | Exceptional 11.3% |
| Immigrants | Nicaragua | 96.8 /100 | #101 | Exceptional 11.3% |
| Immigrants | Eastern Africa | 96.7 /100 | #102 | Exceptional 11.3% |
| Immigrants | Uruguay | 96.4 /100 | #103 | Exceptional 11.3% |
| Immigrants | Immigrants | 96.4 /100 | #104 | Exceptional 11.3% |
| Immigrants | Kazakhstan | 96.4 /100 | #105 | Exceptional 11.3% |
| Immigrants | Eastern Europe | 96.3 /100 | #106 | Exceptional 11.3% |
| Nicaraguans | 96.2 /100 | #107 | Exceptional 11.3% |
| Immigrants | Nigeria | 96.0 /100 | #108 | Exceptional 11.3% |
| Immigrants | Uganda | 95.7 /100 | #109 | Exceptional 11.3% |
Demographics Similar to Northern Europeans by Disability
In terms of disability, the demographic groups most similar to Northern Europeans are Spanish American Indian (12.1%, a difference of 0.040%), Hispanic or Latino (12.1%, a difference of 0.070%), Immigrants from Bahamas (12.1%, a difference of 0.12%), Mexican (12.1%, a difference of 0.14%), and Croatian (12.1%, a difference of 0.16%).
| Demographics | Rating | Rank | Disability |
| Immigrants | Somalia | 6.8 /100 | #214 | Tragic 12.0% |
| Immigrants | Canada | 6.1 /100 | #215 | Tragic 12.1% |
| Panamanians | 5.4 /100 | #216 | Tragic 12.1% |
| Immigrants | North America | 5.3 /100 | #217 | Tragic 12.1% |
| Immigrants | Jamaica | 5.0 /100 | #218 | Tragic 12.1% |
| Croatians | 4.9 /100 | #219 | Tragic 12.1% |
| Immigrants | Bahamas | 4.7 /100 | #220 | Tragic 12.1% |
| Northern Europeans | 4.2 /100 | #221 | Tragic 12.1% |
| Spanish American Indians | 4.1 /100 | #222 | Tragic 12.1% |
| Hispanics or Latinos | 3.9 /100 | #223 | Tragic 12.1% |
| Mexicans | 3.7 /100 | #224 | Tragic 12.1% |
| Senegalese | 3.5 /100 | #225 | Tragic 12.1% |
| Jamaicans | 3.3 /100 | #226 | Tragic 12.1% |
| Alsatians | 3.3 /100 | #227 | Tragic 12.1% |
| West Indians | 2.9 /100 | #228 | Tragic 12.2% |