Immigrants from Hong Kong vs French American Indian Disability
COMPARE
Immigrants from Hong Kong
French American Indian
Disability
Disability Comparison
Immigrants from Hong Kong
French American Indians
10.0%
DISABILITY
100.0/ 100
METRIC RATING
9th/ 347
METRIC RANK
13.5%
DISABILITY
0.0/ 100
METRIC RATING
308th/ 347
METRIC RANK
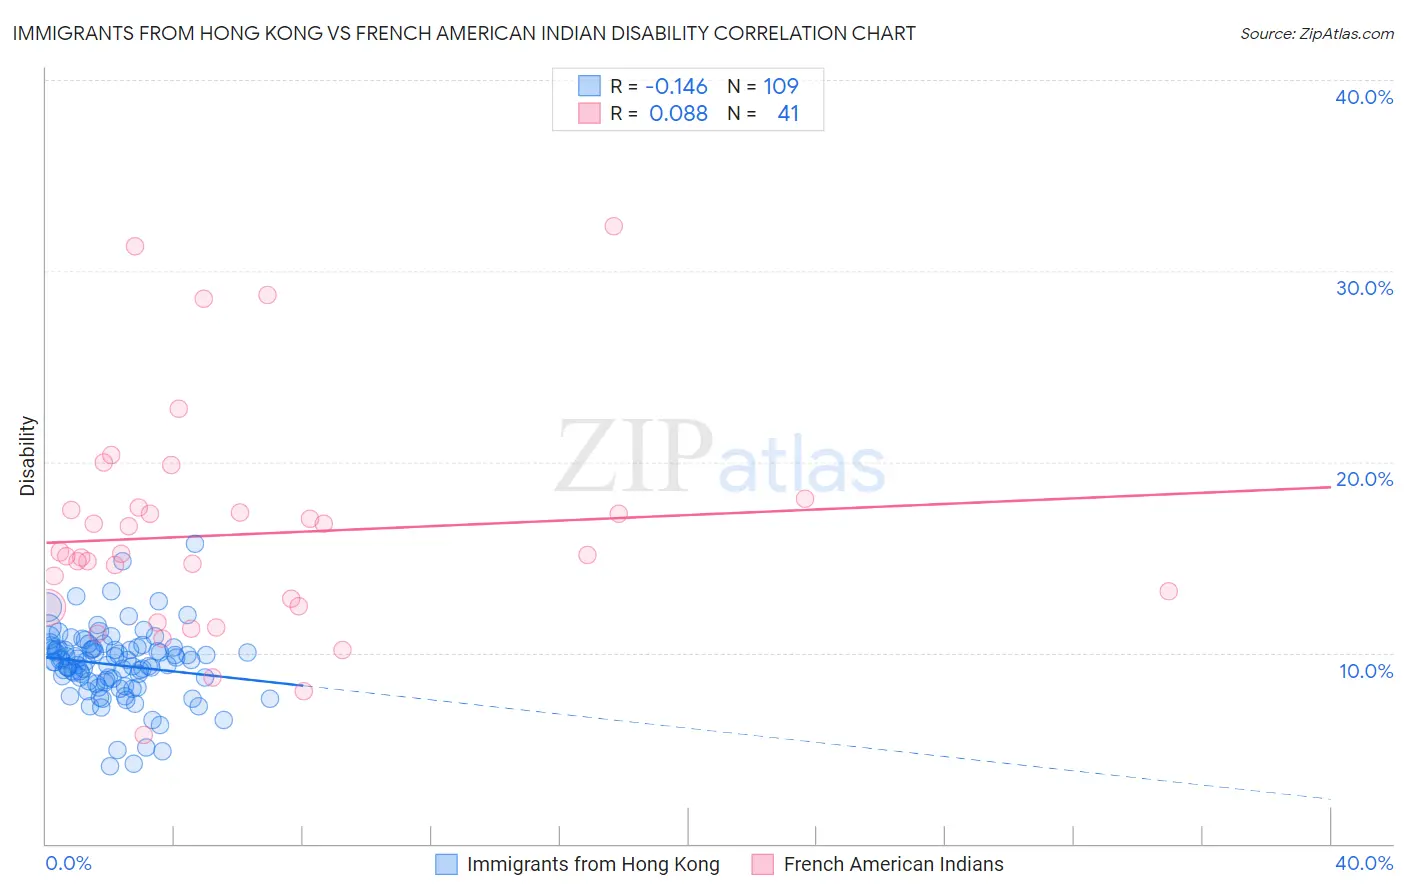
Immigrants from Hong Kong vs French American Indian Disability Correlation Chart
The statistical analysis conducted on geographies consisting of 253,995,136 people shows a poor negative correlation between the proportion of Immigrants from Hong Kong and percentage of population with a disability in the United States with a correlation coefficient (R) of -0.146 and weighted average of 10.0%. Similarly, the statistical analysis conducted on geographies consisting of 131,973,513 people shows a slight positive correlation between the proportion of French American Indians and percentage of population with a disability in the United States with a correlation coefficient (R) of 0.088 and weighted average of 13.5%, a difference of 34.8%.
Disability Correlation Summary
| Measurement | Immigrants from Hong Kong | French American Indian |
| Minimum | 4.0% | 5.7% |
| Maximum | 15.7% | 32.4% |
| Range | 11.7% | 26.7% |
| Mean | 9.4% | 16.2% |
| Median | 9.5% | 15.1% |
| Interquartile 25% (IQ1) | 8.5% | 12.4% |
| Interquartile 75% (IQ3) | 10.2% | 17.5% |
| Interquartile Range (IQR) | 1.8% | 5.1% |
| Standard Deviation (Sample) | 1.9% | 5.8% |
| Standard Deviation (Population) | 1.9% | 5.8% |
Similar Demographics by Disability
Demographics Similar to Immigrants from Hong Kong by Disability
In terms of disability, the demographic groups most similar to Immigrants from Hong Kong are Bolivian (10.0%, a difference of 0.30%), Immigrants from Singapore (10.0%, a difference of 0.52%), Immigrants from China (10.1%, a difference of 0.81%), Iranian (10.1%, a difference of 0.82%), and Immigrants from South Central Asia (9.9%, a difference of 0.84%).
| Demographics | Rating | Rank | Disability |
| Filipinos | 100.0 /100 | #2 | Exceptional 9.6% |
| Immigrants | Taiwan | 100.0 /100 | #3 | Exceptional 9.6% |
| Thais | 100.0 /100 | #4 | Exceptional 9.7% |
| Immigrants | Bolivia | 100.0 /100 | #5 | Exceptional 9.9% |
| Immigrants | South Central Asia | 100.0 /100 | #6 | Exceptional 9.9% |
| Immigrants | Singapore | 100.0 /100 | #7 | Exceptional 10.0% |
| Bolivians | 100.0 /100 | #8 | Exceptional 10.0% |
| Immigrants | Hong Kong | 100.0 /100 | #9 | Exceptional 10.0% |
| Immigrants | China | 100.0 /100 | #10 | Exceptional 10.1% |
| Iranians | 100.0 /100 | #11 | Exceptional 10.1% |
| Immigrants | Israel | 100.0 /100 | #12 | Exceptional 10.1% |
| Immigrants | Eastern Asia | 100.0 /100 | #13 | Exceptional 10.2% |
| Immigrants | Korea | 100.0 /100 | #14 | Exceptional 10.2% |
| Okinawans | 100.0 /100 | #15 | Exceptional 10.3% |
| Indians (Asian) | 100.0 /100 | #16 | Exceptional 10.3% |
Demographics Similar to French American Indians by Disability
In terms of disability, the demographic groups most similar to French American Indians are Tlingit-Haida (13.5%, a difference of 0.080%), Shoshone (13.5%, a difference of 0.090%), Cape Verdean (13.5%, a difference of 0.14%), Blackfeet (13.6%, a difference of 0.61%), and Delaware (13.6%, a difference of 0.65%).
| Demographics | Rating | Rank | Disability |
| Immigrants | Micronesia | 0.0 /100 | #301 | Tragic 13.2% |
| Arapaho | 0.0 /100 | #302 | Tragic 13.2% |
| Scotch-Irish | 0.0 /100 | #303 | Tragic 13.3% |
| Yakama | 0.0 /100 | #304 | Tragic 13.4% |
| French Canadians | 0.0 /100 | #305 | Tragic 13.4% |
| Cape Verdeans | 0.0 /100 | #306 | Tragic 13.5% |
| Shoshone | 0.0 /100 | #307 | Tragic 13.5% |
| French American Indians | 0.0 /100 | #308 | Tragic 13.5% |
| Tlingit-Haida | 0.0 /100 | #309 | Tragic 13.5% |
| Blackfeet | 0.0 /100 | #310 | Tragic 13.6% |
| Delaware | 0.0 /100 | #311 | Tragic 13.6% |
| Spanish Americans | 0.0 /100 | #312 | Tragic 13.6% |
| Cree | 0.0 /100 | #313 | Tragic 13.7% |
| Blacks/African Americans | 0.0 /100 | #314 | Tragic 13.7% |
| Puget Sound Salish | 0.0 /100 | #315 | Tragic 13.7% |