Black/African American vs Scottish Hearing Disability
COMPARE
Black/African American
Scottish
Hearing Disability
Hearing Disability Comparison
Blacks/African Americans
Scottish
3.0%
HEARING DISABILITY
34.7/ 100
METRIC RATING
187th/ 347
METRIC RANK
3.7%
HEARING DISABILITY
0.0/ 100
METRIC RATING
300th/ 347
METRIC RANK
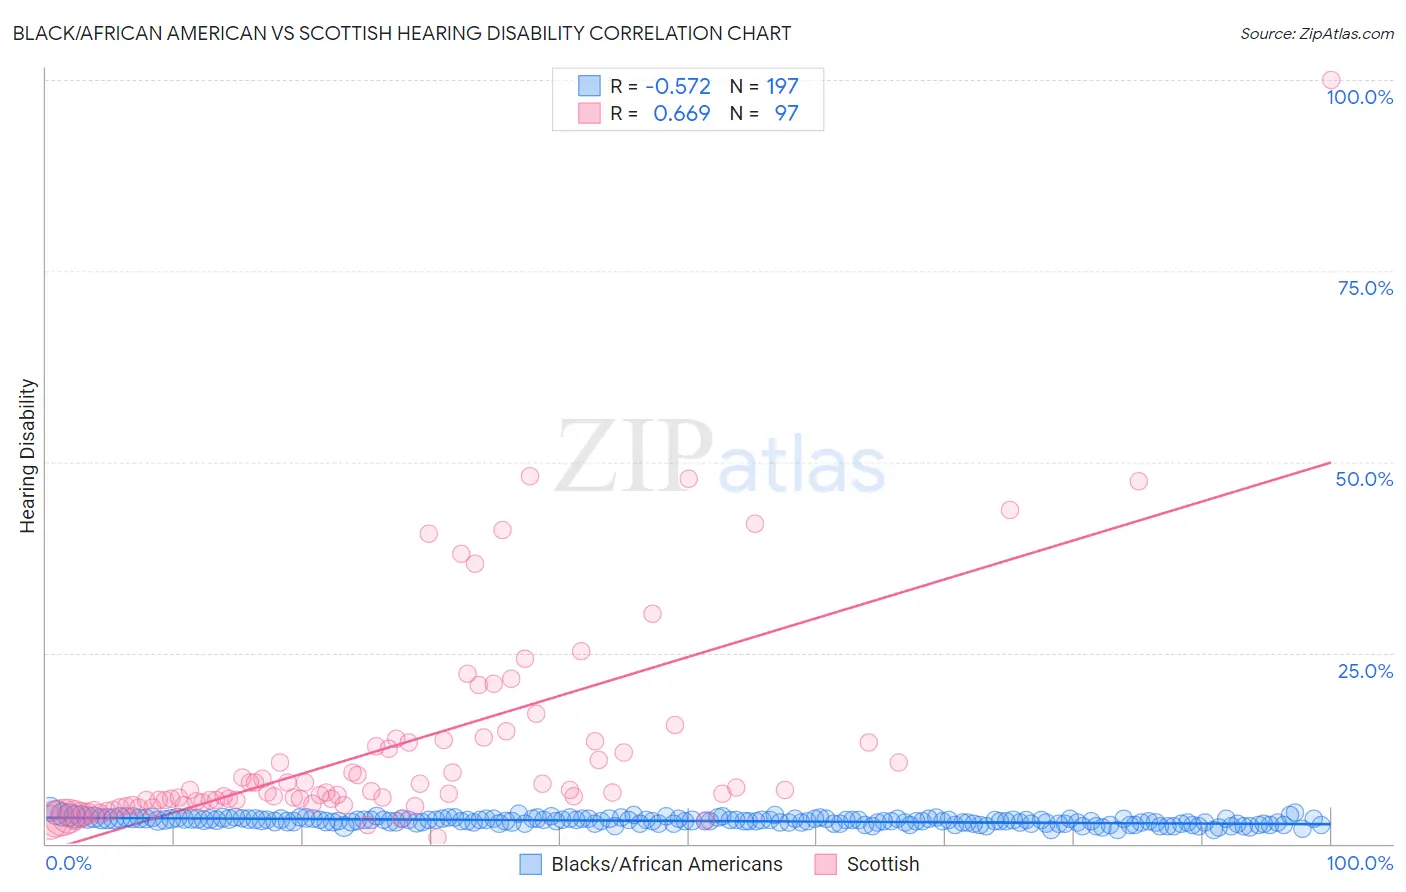
Black/African American vs Scottish Hearing Disability Correlation Chart
The statistical analysis conducted on geographies consisting of 565,046,012 people shows a substantial negative correlation between the proportion of Blacks/African Americans and percentage of population with hearing disability in the United States with a correlation coefficient (R) of -0.572 and weighted average of 3.0%. Similarly, the statistical analysis conducted on geographies consisting of 566,483,062 people shows a significant positive correlation between the proportion of Scottish and percentage of population with hearing disability in the United States with a correlation coefficient (R) of 0.669 and weighted average of 3.7%, a difference of 22.9%.
Hearing Disability Correlation Summary
| Measurement | Black/African American | Scottish |
| Minimum | 1.7% | 0.87% |
| Maximum | 4.5% | 100.0% |
| Range | 2.8% | 99.1% |
| Mean | 3.0% | 12.6% |
| Median | 3.0% | 6.8% |
| Interquartile 25% (IQ1) | 2.7% | 5.4% |
| Interquartile 75% (IQ3) | 3.3% | 13.4% |
| Interquartile Range (IQR) | 0.56% | 8.0% |
| Standard Deviation (Sample) | 0.43% | 14.5% |
| Standard Deviation (Population) | 0.43% | 14.4% |
Similar Demographics by Hearing Disability
Demographics Similar to Blacks/African Americans by Hearing Disability
In terms of hearing disability, the demographic groups most similar to Blacks/African Americans are Immigrants from Mexico (3.0%, a difference of 0.010%), Mexican American Indian (3.0%, a difference of 0.010%), Immigrants from Southern Europe (3.0%, a difference of 0.060%), African (3.0%, a difference of 0.19%), and Immigrants from Ireland (3.0%, a difference of 0.27%).
| Demographics | Rating | Rank | Hearing Disability |
| Immigrants | Sweden | 42.4 /100 | #180 | Average 3.0% |
| Immigrants | Belgium | 41.5 /100 | #181 | Average 3.0% |
| Immigrants | Italy | 41.1 /100 | #182 | Average 3.0% |
| Bulgarians | 39.7 /100 | #183 | Fair 3.0% |
| Immigrants | Ireland | 37.4 /100 | #184 | Fair 3.0% |
| Immigrants | Southern Europe | 35.3 /100 | #185 | Fair 3.0% |
| Immigrants | Mexico | 34.9 /100 | #186 | Fair 3.0% |
| Blacks/African Americans | 34.7 /100 | #187 | Fair 3.0% |
| Mexican American Indians | 34.7 /100 | #188 | Fair 3.0% |
| Africans | 32.9 /100 | #189 | Fair 3.0% |
| Immigrants | South Africa | 31.1 /100 | #190 | Fair 3.1% |
| Immigrants | Switzerland | 28.8 /100 | #191 | Fair 3.1% |
| Koreans | 27.6 /100 | #192 | Fair 3.1% |
| Macedonians | 27.0 /100 | #193 | Fair 3.1% |
| South Africans | 24.5 /100 | #194 | Fair 3.1% |
Demographics Similar to Scottish by Hearing Disability
In terms of hearing disability, the demographic groups most similar to Scottish are Pennsylvania German (3.7%, a difference of 0.030%), German (3.7%, a difference of 0.060%), Dutch (3.7%, a difference of 0.13%), Menominee (3.7%, a difference of 0.19%), and Celtic (3.7%, a difference of 0.34%).
| Demographics | Rating | Rank | Hearing Disability |
| Norwegians | 0.0 /100 | #293 | Tragic 3.7% |
| Iroquois | 0.0 /100 | #294 | Tragic 3.7% |
| Welsh | 0.0 /100 | #295 | Tragic 3.7% |
| Pima | 0.0 /100 | #296 | Tragic 3.7% |
| Immigrants | Azores | 0.0 /100 | #297 | Tragic 3.7% |
| Celtics | 0.0 /100 | #298 | Tragic 3.7% |
| Germans | 0.0 /100 | #299 | Tragic 3.7% |
| Scottish | 0.0 /100 | #300 | Tragic 3.7% |
| Pennsylvania Germans | 0.0 /100 | #301 | Tragic 3.7% |
| Dutch | 0.0 /100 | #302 | Tragic 3.7% |
| Menominee | 0.0 /100 | #303 | Tragic 3.7% |
| French | 0.0 /100 | #304 | Tragic 3.8% |
| English | 0.0 /100 | #305 | Tragic 3.8% |
| Marshallese | 0.0 /100 | #306 | Tragic 3.8% |
| French Canadians | 0.0 /100 | #307 | Tragic 3.8% |