Black/African American vs Immigrants from St. Vincent and the Grenadines Disability Age Under 5
COMPARE
Black/African American
Immigrants from St. Vincent and the Grenadines
Disability Age Under 5
Disability Age Under 5 Comparison
Blacks/African Americans
Immigrants from St. Vincent and the Grenadines
1.4%
DISABILITY AGE UNDER 5
0.1/ 100
METRIC RATING
272nd/ 347
METRIC RANK
0.79%
DISABILITY AGE UNDER 5
100.0/ 100
METRIC RATING
2nd/ 347
METRIC RANK
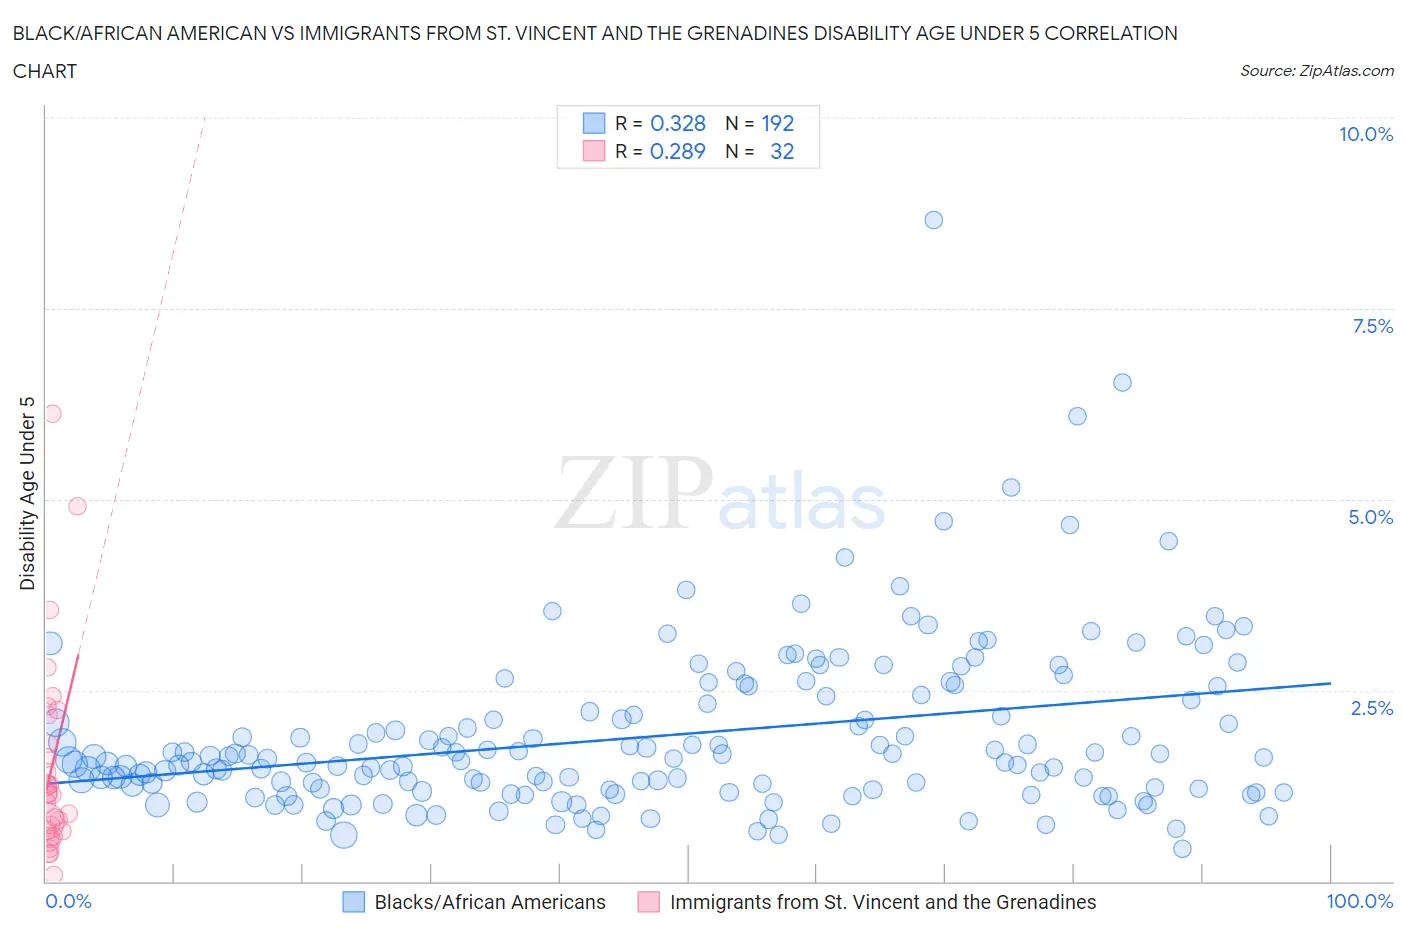
Black/African American vs Immigrants from St. Vincent and the Grenadines Disability Age Under 5 Correlation Chart
The statistical analysis conducted on geographies consisting of 261,159,636 people shows a mild positive correlation between the proportion of Blacks/African Americans and percentage of population with a disability under the age of 5 in the United States with a correlation coefficient (R) of 0.328 and weighted average of 1.4%. Similarly, the statistical analysis conducted on geographies consisting of 43,198,055 people shows a weak positive correlation between the proportion of Immigrants from St. Vincent and the Grenadines and percentage of population with a disability under the age of 5 in the United States with a correlation coefficient (R) of 0.289 and weighted average of 0.79%, a difference of 83.8%.
Disability Age Under 5 Correlation Summary
| Measurement | Black/African American | Immigrants from St. Vincent and the Grenadines |
| Minimum | 0.43% | 0.086% |
| Maximum | 8.7% | 6.1% |
| Range | 8.2% | 6.0% |
| Mean | 1.9% | 1.5% |
| Median | 1.6% | 1.1% |
| Interquartile 25% (IQ1) | 1.2% | 0.66% |
| Interquartile 75% (IQ3) | 2.4% | 2.0% |
| Interquartile Range (IQR) | 1.2% | 1.3% |
| Standard Deviation (Sample) | 1.1% | 1.3% |
| Standard Deviation (Population) | 1.1% | 1.3% |
Similar Demographics by Disability Age Under 5
Demographics Similar to Blacks/African Americans by Disability Age Under 5
In terms of disability age under 5, the demographic groups most similar to Blacks/African Americans are Immigrants from Canada (1.4%, a difference of 0.16%), Immigrants from North America (1.4%, a difference of 0.20%), Alaskan Athabascan (1.5%, a difference of 0.29%), Austrian (1.4%, a difference of 0.33%), and Belgian (1.4%, a difference of 0.51%).
| Demographics | Rating | Rank | Disability Age Under 5 |
| Carpatho Rusyns | 0.1 /100 | #265 | Tragic 1.4% |
| Immigrants | Germany | 0.1 /100 | #266 | Tragic 1.4% |
| Cree | 0.1 /100 | #267 | Tragic 1.4% |
| Belgians | 0.1 /100 | #268 | Tragic 1.4% |
| Austrians | 0.1 /100 | #269 | Tragic 1.4% |
| Immigrants | North America | 0.1 /100 | #270 | Tragic 1.4% |
| Immigrants | Canada | 0.1 /100 | #271 | Tragic 1.4% |
| Blacks/African Americans | 0.1 /100 | #272 | Tragic 1.4% |
| Alaskan Athabascans | 0.1 /100 | #273 | Tragic 1.5% |
| Iroquois | 0.0 /100 | #274 | Tragic 1.5% |
| Brazilians | 0.0 /100 | #275 | Tragic 1.5% |
| Greeks | 0.0 /100 | #276 | Tragic 1.5% |
| Canadians | 0.0 /100 | #277 | Tragic 1.5% |
| Kiowa | 0.0 /100 | #278 | Tragic 1.5% |
| Danes | 0.0 /100 | #279 | Tragic 1.5% |
Demographics Similar to Immigrants from St. Vincent and the Grenadines by Disability Age Under 5
In terms of disability age under 5, the demographic groups most similar to Immigrants from St. Vincent and the Grenadines are Vietnamese (0.81%, a difference of 3.2%), Immigrants from Armenia (0.76%, a difference of 4.1%), Immigrants from Uzbekistan (0.85%, a difference of 7.9%), Immigrants from Bangladesh (0.85%, a difference of 8.4%), and Ute (0.86%, a difference of 9.4%).
| Demographics | Rating | Rank | Disability Age Under 5 |
| Immigrants | Armenia | 100.0 /100 | #1 | Exceptional 0.76% |
| Immigrants | St. Vincent and the Grenadines | 100.0 /100 | #2 | Exceptional 0.79% |
| Vietnamese | 100.0 /100 | #3 | Exceptional 0.81% |
| Immigrants | Uzbekistan | 100.0 /100 | #4 | Exceptional 0.85% |
| Immigrants | Bangladesh | 100.0 /100 | #5 | Exceptional 0.85% |
| Ute | 100.0 /100 | #6 | Exceptional 0.86% |
| Immigrants | Afghanistan | 100.0 /100 | #7 | Exceptional 0.91% |
| Immigrants | Yemen | 100.0 /100 | #8 | Exceptional 0.91% |
| Immigrants | Fiji | 100.0 /100 | #9 | Exceptional 0.92% |
| Marshallese | 100.0 /100 | #10 | Exceptional 0.94% |
| Afghans | 100.0 /100 | #11 | Exceptional 0.94% |
| Immigrants | Grenada | 100.0 /100 | #12 | Exceptional 0.94% |
| Soviet Union | 100.0 /100 | #13 | Exceptional 0.95% |
| Yuman | 100.0 /100 | #14 | Exceptional 0.95% |
| Immigrants | Hong Kong | 100.0 /100 | #15 | Exceptional 0.95% |