Black/African American vs Immigrants from Spain Disability Age Under 5
COMPARE
Black/African American
Immigrants from Spain
Disability Age Under 5
Disability Age Under 5 Comparison
Blacks/African Americans
Immigrants from Spain
1.4%
DISABILITY AGE UNDER 5
0.1/ 100
METRIC RATING
272nd/ 347
METRIC RANK
1.2%
DISABILITY AGE UNDER 5
86.5/ 100
METRIC RATING
133rd/ 347
METRIC RANK
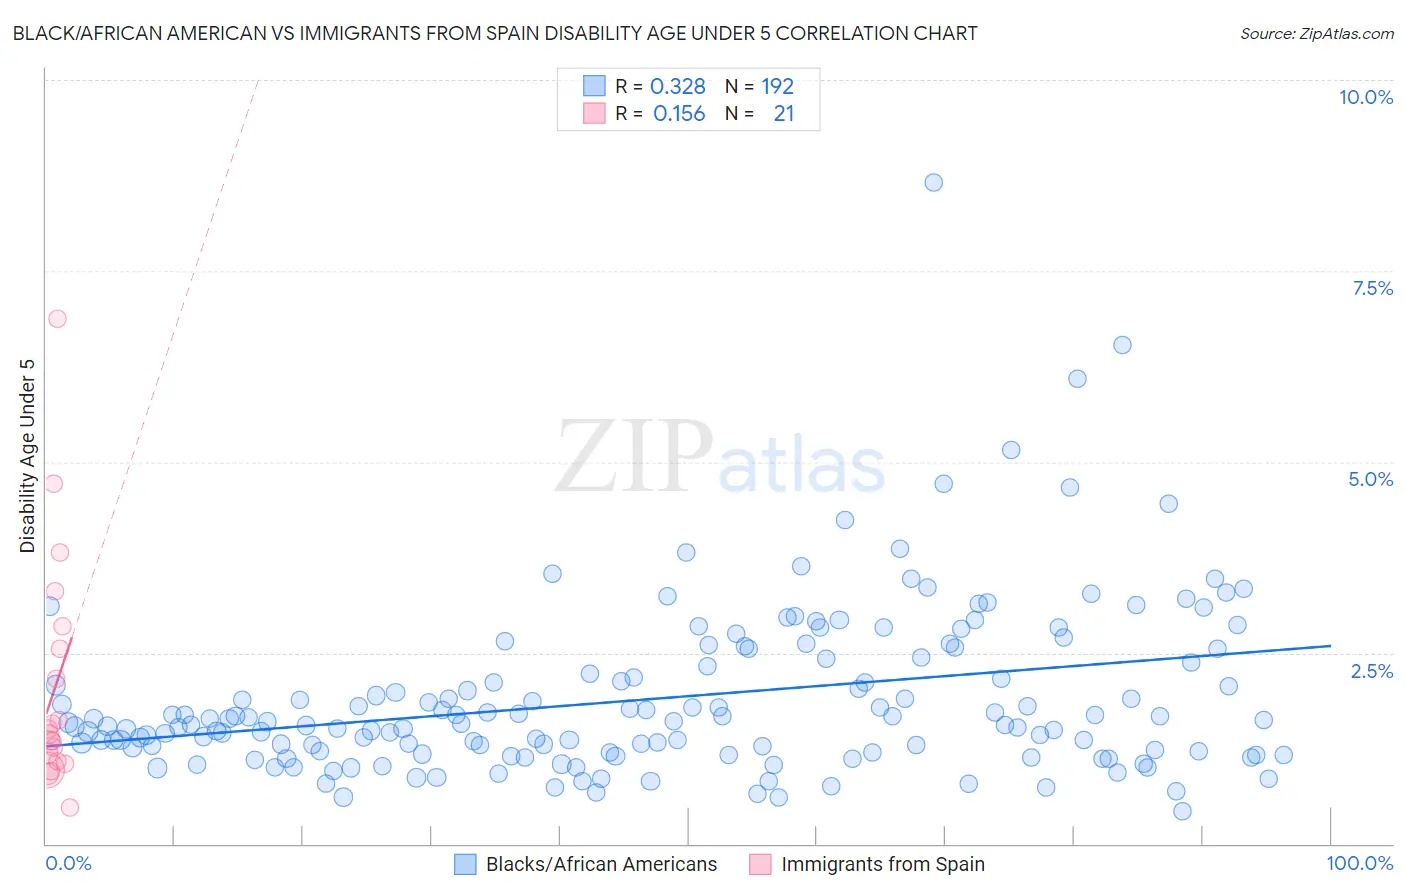
Black/African American vs Immigrants from Spain Disability Age Under 5 Correlation Chart
The statistical analysis conducted on geographies consisting of 261,159,636 people shows a mild positive correlation between the proportion of Blacks/African Americans and percentage of population with a disability under the age of 5 in the United States with a correlation coefficient (R) of 0.328 and weighted average of 1.4%. Similarly, the statistical analysis conducted on geographies consisting of 150,109,645 people shows a poor positive correlation between the proportion of Immigrants from Spain and percentage of population with a disability under the age of 5 in the United States with a correlation coefficient (R) of 0.156 and weighted average of 1.2%, a difference of 21.8%.
Disability Age Under 5 Correlation Summary
| Measurement | Black/African American | Immigrants from Spain |
| Minimum | 0.43% | 0.48% |
| Maximum | 8.7% | 6.9% |
| Range | 8.2% | 6.4% |
| Mean | 1.9% | 2.0% |
| Median | 1.6% | 1.4% |
| Interquartile 25% (IQ1) | 1.2% | 1.1% |
| Interquartile 75% (IQ3) | 2.4% | 2.7% |
| Interquartile Range (IQR) | 1.2% | 1.6% |
| Standard Deviation (Sample) | 1.1% | 1.5% |
| Standard Deviation (Population) | 1.1% | 1.5% |
Similar Demographics by Disability Age Under 5
Demographics Similar to Blacks/African Americans by Disability Age Under 5
In terms of disability age under 5, the demographic groups most similar to Blacks/African Americans are Immigrants from Canada (1.4%, a difference of 0.16%), Immigrants from North America (1.4%, a difference of 0.20%), Alaskan Athabascan (1.5%, a difference of 0.29%), Austrian (1.4%, a difference of 0.33%), and Belgian (1.4%, a difference of 0.51%).
| Demographics | Rating | Rank | Disability Age Under 5 |
| Carpatho Rusyns | 0.1 /100 | #265 | Tragic 1.4% |
| Immigrants | Germany | 0.1 /100 | #266 | Tragic 1.4% |
| Cree | 0.1 /100 | #267 | Tragic 1.4% |
| Belgians | 0.1 /100 | #268 | Tragic 1.4% |
| Austrians | 0.1 /100 | #269 | Tragic 1.4% |
| Immigrants | North America | 0.1 /100 | #270 | Tragic 1.4% |
| Immigrants | Canada | 0.1 /100 | #271 | Tragic 1.4% |
| Blacks/African Americans | 0.1 /100 | #272 | Tragic 1.4% |
| Alaskan Athabascans | 0.1 /100 | #273 | Tragic 1.5% |
| Iroquois | 0.0 /100 | #274 | Tragic 1.5% |
| Brazilians | 0.0 /100 | #275 | Tragic 1.5% |
| Greeks | 0.0 /100 | #276 | Tragic 1.5% |
| Canadians | 0.0 /100 | #277 | Tragic 1.5% |
| Kiowa | 0.0 /100 | #278 | Tragic 1.5% |
| Danes | 0.0 /100 | #279 | Tragic 1.5% |
Demographics Similar to Immigrants from Spain by Disability Age Under 5
In terms of disability age under 5, the demographic groups most similar to Immigrants from Spain are Immigrants from Eastern Europe (1.2%, a difference of 0.16%), Argentinean (1.2%, a difference of 0.16%), Immigrants from Serbia (1.2%, a difference of 0.23%), Korean (1.2%, a difference of 0.24%), and Immigrants (1.2%, a difference of 0.32%).
| Demographics | Rating | Rank | Disability Age Under 5 |
| Central Americans | 89.7 /100 | #126 | Excellent 1.2% |
| Immigrants | Romania | 88.4 /100 | #127 | Excellent 1.2% |
| Immigrants | France | 88.4 /100 | #128 | Excellent 1.2% |
| Immigrants | Immigrants | 88.0 /100 | #129 | Excellent 1.2% |
| Koreans | 87.7 /100 | #130 | Excellent 1.2% |
| Immigrants | Serbia | 87.6 /100 | #131 | Excellent 1.2% |
| Immigrants | Eastern Europe | 87.3 /100 | #132 | Excellent 1.2% |
| Immigrants | Spain | 86.5 /100 | #133 | Excellent 1.2% |
| Argentineans | 85.7 /100 | #134 | Excellent 1.2% |
| Fijians | 84.7 /100 | #135 | Excellent 1.2% |
| Moroccans | 83.6 /100 | #136 | Excellent 1.2% |
| Immigrants | Eastern Africa | 83.1 /100 | #137 | Excellent 1.2% |
| Immigrants | Czechoslovakia | 82.8 /100 | #138 | Excellent 1.2% |
| New Zealanders | 81.4 /100 | #139 | Excellent 1.2% |
| Somalis | 80.8 /100 | #140 | Excellent 1.2% |