Sudanese vs Immigrants from Ethiopia Disability Age 5 to 17
COMPARE
Sudanese
Immigrants from Ethiopia
Disability Age 5 to 17
Disability Age 5 to 17 Comparison
Sudanese
Immigrants from Ethiopia
5.8%
DISABILITY AGE 5 TO 17
2.9/ 100
METRIC RATING
237th/ 347
METRIC RANK
5.4%
DISABILITY AGE 5 TO 17
95.5/ 100
METRIC RATING
123rd/ 347
METRIC RANK
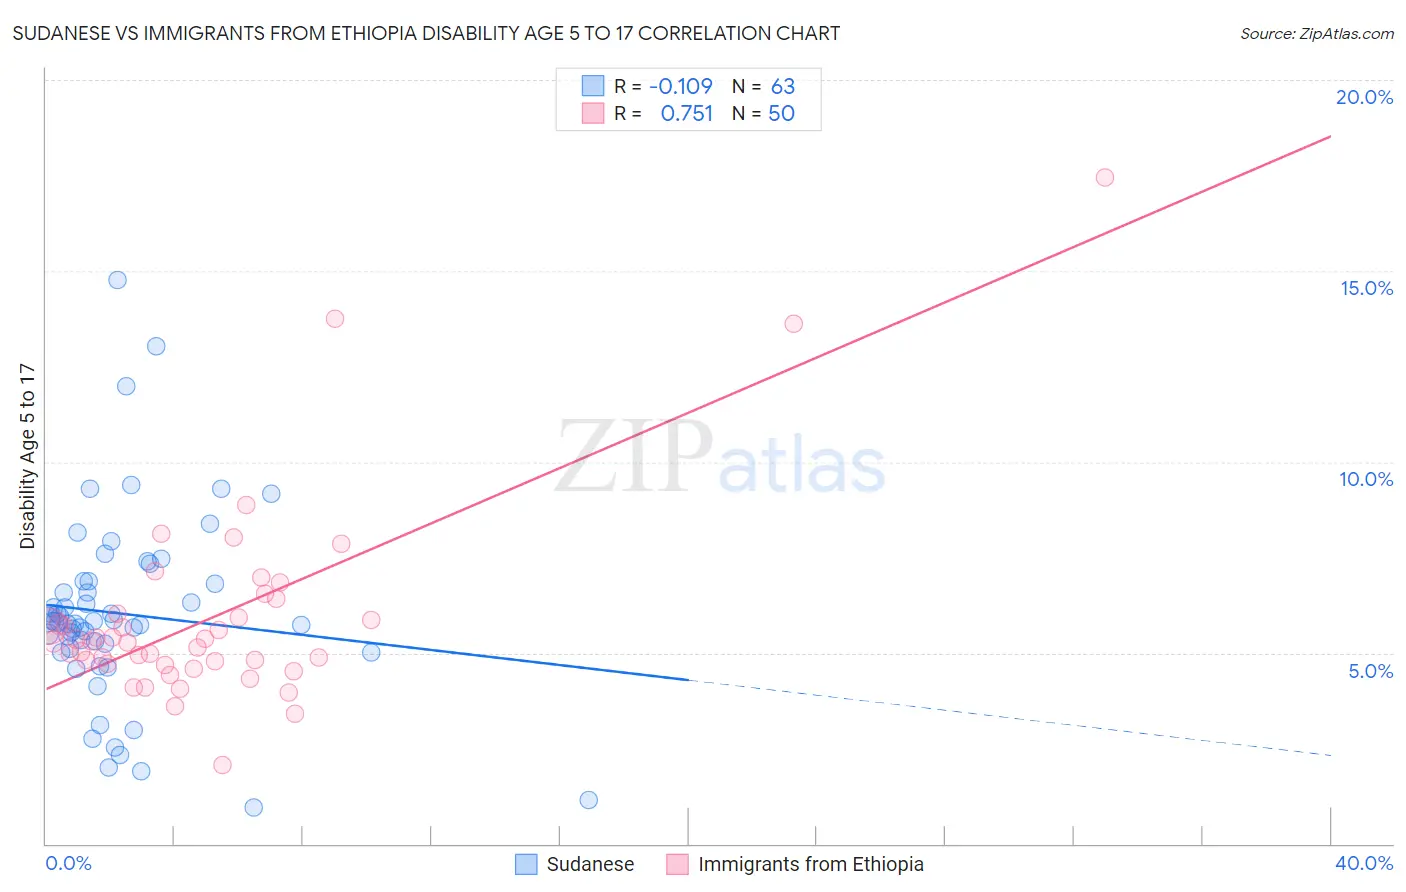
Sudanese vs Immigrants from Ethiopia Disability Age 5 to 17 Correlation Chart
The statistical analysis conducted on geographies consisting of 109,989,475 people shows a poor negative correlation between the proportion of Sudanese and percentage of population with a disability between the ages 5 and 17 in the United States with a correlation coefficient (R) of -0.109 and weighted average of 5.8%. Similarly, the statistical analysis conducted on geographies consisting of 210,785,168 people shows a strong positive correlation between the proportion of Immigrants from Ethiopia and percentage of population with a disability between the ages 5 and 17 in the United States with a correlation coefficient (R) of 0.751 and weighted average of 5.4%, a difference of 8.5%.
Disability Age 5 to 17 Correlation Summary
| Measurement | Sudanese | Immigrants from Ethiopia |
| Minimum | 0.94% | 2.1% |
| Maximum | 14.8% | 17.5% |
| Range | 13.8% | 15.4% |
| Mean | 6.0% | 5.9% |
| Median | 5.8% | 5.3% |
| Interquartile 25% (IQ1) | 5.1% | 4.7% |
| Interquartile 75% (IQ3) | 6.9% | 6.0% |
| Interquartile Range (IQR) | 1.7% | 1.3% |
| Standard Deviation (Sample) | 2.5% | 2.6% |
| Standard Deviation (Population) | 2.5% | 2.6% |
Similar Demographics by Disability Age 5 to 17
Demographics Similar to Sudanese by Disability Age 5 to 17
In terms of disability age 5 to 17, the demographic groups most similar to Sudanese are Hungarian (5.8%, a difference of 0.10%), Immigrants from Brazil (5.8%, a difference of 0.15%), German Russian (5.9%, a difference of 0.20%), Malaysian (5.8%, a difference of 0.21%), and Immigrants from Kenya (5.8%, a difference of 0.22%).
| Demographics | Rating | Rank | Disability Age 5 to 17 |
| Ghanaians | 4.7 /100 | #230 | Tragic 5.8% |
| Europeans | 4.5 /100 | #231 | Tragic 5.8% |
| Immigrants | Laos | 3.8 /100 | #232 | Tragic 5.8% |
| Immigrants | West Indies | 3.5 /100 | #233 | Tragic 5.8% |
| Immigrants | Kenya | 3.4 /100 | #234 | Tragic 5.8% |
| Malaysians | 3.4 /100 | #235 | Tragic 5.8% |
| Immigrants | Brazil | 3.2 /100 | #236 | Tragic 5.8% |
| Sudanese | 2.9 /100 | #237 | Tragic 5.8% |
| Hungarians | 2.6 /100 | #238 | Tragic 5.8% |
| German Russians | 2.4 /100 | #239 | Tragic 5.9% |
| West Indians | 2.4 /100 | #240 | Tragic 5.9% |
| Immigrants | Caribbean | 2.1 /100 | #241 | Tragic 5.9% |
| Spaniards | 2.0 /100 | #242 | Tragic 5.9% |
| Indonesians | 2.0 /100 | #243 | Tragic 5.9% |
| Immigrants | Germany | 1.9 /100 | #244 | Tragic 5.9% |
Demographics Similar to Immigrants from Ethiopia by Disability Age 5 to 17
In terms of disability age 5 to 17, the demographic groups most similar to Immigrants from Ethiopia are Chilean (5.4%, a difference of 0.10%), Crow (5.4%, a difference of 0.13%), Immigrants from Chile (5.4%, a difference of 0.15%), Maltese (5.4%, a difference of 0.16%), and New Zealander (5.4%, a difference of 0.16%).
| Demographics | Rating | Rank | Disability Age 5 to 17 |
| Cypriots | 97.7 /100 | #116 | Exceptional 5.3% |
| Immigrants | Afghanistan | 97.4 /100 | #117 | Exceptional 5.3% |
| South Americans | 97.1 /100 | #118 | Exceptional 5.4% |
| Immigrants | South America | 97.1 /100 | #119 | Exceptional 5.4% |
| Immigrants | Immigrants | 97.0 /100 | #120 | Exceptional 5.4% |
| Maltese | 96.0 /100 | #121 | Exceptional 5.4% |
| Chileans | 95.8 /100 | #122 | Exceptional 5.4% |
| Immigrants | Ethiopia | 95.5 /100 | #123 | Exceptional 5.4% |
| Crow | 95.0 /100 | #124 | Exceptional 5.4% |
| Immigrants | Chile | 95.0 /100 | #125 | Exceptional 5.4% |
| New Zealanders | 95.0 /100 | #126 | Exceptional 5.4% |
| Latvians | 95.0 /100 | #127 | Exceptional 5.4% |
| Immigrants | Venezuela | 94.5 /100 | #128 | Exceptional 5.4% |
| Romanians | 94.1 /100 | #129 | Exceptional 5.4% |
| Immigrants | Bulgaria | 94.0 /100 | #130 | Exceptional 5.4% |