Cree vs Immigrants from Ethiopia Disability Age 5 to 17
COMPARE
Cree
Immigrants from Ethiopia
Disability Age 5 to 17
Disability Age 5 to 17 Comparison
Cree
Immigrants from Ethiopia
6.2%
DISABILITY AGE 5 TO 17
0.0/ 100
METRIC RATING
295th/ 347
METRIC RANK
5.4%
DISABILITY AGE 5 TO 17
95.5/ 100
METRIC RATING
123rd/ 347
METRIC RANK
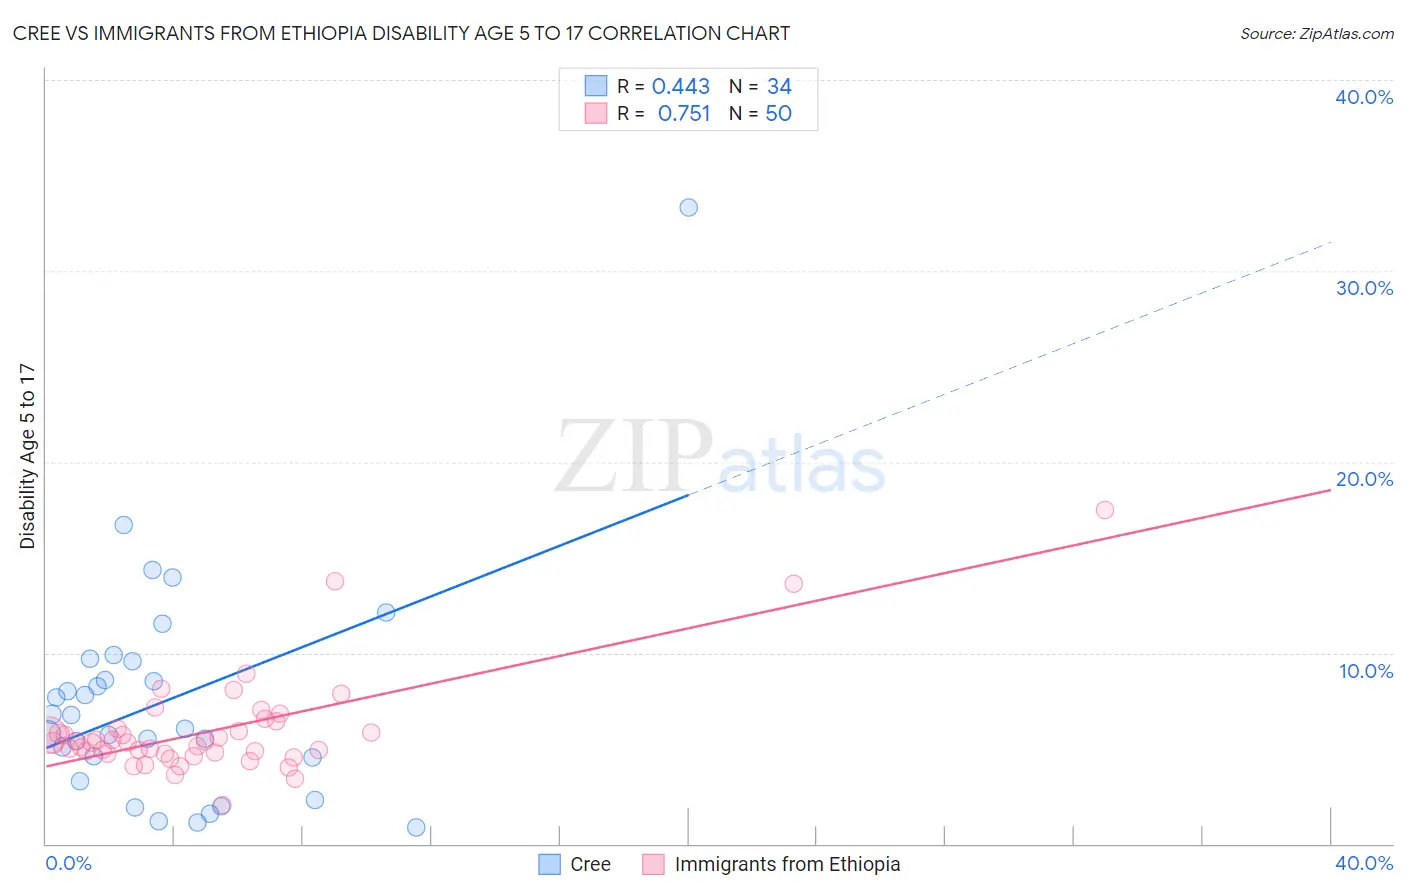
Cree vs Immigrants from Ethiopia Disability Age 5 to 17 Correlation Chart
The statistical analysis conducted on geographies consisting of 76,040,130 people shows a moderate positive correlation between the proportion of Cree and percentage of population with a disability between the ages 5 and 17 in the United States with a correlation coefficient (R) of 0.443 and weighted average of 6.2%. Similarly, the statistical analysis conducted on geographies consisting of 210,785,168 people shows a strong positive correlation between the proportion of Immigrants from Ethiopia and percentage of population with a disability between the ages 5 and 17 in the United States with a correlation coefficient (R) of 0.751 and weighted average of 5.4%, a difference of 15.7%.
Disability Age 5 to 17 Correlation Summary
| Measurement | Cree | Immigrants from Ethiopia |
| Minimum | 0.85% | 2.1% |
| Maximum | 33.3% | 17.5% |
| Range | 32.5% | 15.4% |
| Mean | 7.5% | 5.9% |
| Median | 6.4% | 5.3% |
| Interquartile 25% (IQ1) | 4.5% | 4.7% |
| Interquartile 75% (IQ3) | 9.6% | 6.0% |
| Interquartile Range (IQR) | 5.0% | 1.3% |
| Standard Deviation (Sample) | 6.0% | 2.6% |
| Standard Deviation (Population) | 6.0% | 2.6% |
Similar Demographics by Disability Age 5 to 17
Demographics Similar to Cree by Disability Age 5 to 17
In terms of disability age 5 to 17, the demographic groups most similar to Cree are Spanish American (6.2%, a difference of 0.020%), Immigrants from Bahamas (6.2%, a difference of 0.15%), Lumbee (6.2%, a difference of 0.22%), Irish (6.2%, a difference of 0.27%), and Central American Indian (6.2%, a difference of 0.28%).
| Demographics | Rating | Rank | Disability Age 5 to 17 |
| Jamaicans | 0.0 /100 | #288 | Tragic 6.2% |
| Yaqui | 0.0 /100 | #289 | Tragic 6.2% |
| Immigrants | Congo | 0.0 /100 | #290 | Tragic 6.2% |
| Whites/Caucasians | 0.0 /100 | #291 | Tragic 6.2% |
| Immigrants | Senegal | 0.0 /100 | #292 | Tragic 6.2% |
| Central American Indians | 0.0 /100 | #293 | Tragic 6.2% |
| Irish | 0.0 /100 | #294 | Tragic 6.2% |
| Cree | 0.0 /100 | #295 | Tragic 6.2% |
| Spanish Americans | 0.0 /100 | #296 | Tragic 6.2% |
| Immigrants | Bahamas | 0.0 /100 | #297 | Tragic 6.2% |
| Lumbee | 0.0 /100 | #298 | Tragic 6.2% |
| Welsh | 0.0 /100 | #299 | Tragic 6.3% |
| Carpatho Rusyns | 0.0 /100 | #300 | Tragic 6.3% |
| U.S. Virgin Islanders | 0.0 /100 | #301 | Tragic 6.3% |
| Celtics | 0.0 /100 | #302 | Tragic 6.3% |
Demographics Similar to Immigrants from Ethiopia by Disability Age 5 to 17
In terms of disability age 5 to 17, the demographic groups most similar to Immigrants from Ethiopia are Chilean (5.4%, a difference of 0.10%), Crow (5.4%, a difference of 0.13%), Immigrants from Chile (5.4%, a difference of 0.15%), Maltese (5.4%, a difference of 0.16%), and New Zealander (5.4%, a difference of 0.16%).
| Demographics | Rating | Rank | Disability Age 5 to 17 |
| Cypriots | 97.7 /100 | #116 | Exceptional 5.3% |
| Immigrants | Afghanistan | 97.4 /100 | #117 | Exceptional 5.3% |
| South Americans | 97.1 /100 | #118 | Exceptional 5.4% |
| Immigrants | South America | 97.1 /100 | #119 | Exceptional 5.4% |
| Immigrants | Immigrants | 97.0 /100 | #120 | Exceptional 5.4% |
| Maltese | 96.0 /100 | #121 | Exceptional 5.4% |
| Chileans | 95.8 /100 | #122 | Exceptional 5.4% |
| Immigrants | Ethiopia | 95.5 /100 | #123 | Exceptional 5.4% |
| Crow | 95.0 /100 | #124 | Exceptional 5.4% |
| Immigrants | Chile | 95.0 /100 | #125 | Exceptional 5.4% |
| New Zealanders | 95.0 /100 | #126 | Exceptional 5.4% |
| Latvians | 95.0 /100 | #127 | Exceptional 5.4% |
| Immigrants | Venezuela | 94.5 /100 | #128 | Exceptional 5.4% |
| Romanians | 94.1 /100 | #129 | Exceptional 5.4% |
| Immigrants | Bulgaria | 94.0 /100 | #130 | Exceptional 5.4% |