Hmong vs Immigrants from Ethiopia Disability Age 5 to 17
COMPARE
Hmong
Immigrants from Ethiopia
Disability Age 5 to 17
Disability Age 5 to 17 Comparison
Hmong
Immigrants from Ethiopia
6.3%
DISABILITY AGE 5 TO 17
0.0/ 100
METRIC RATING
309th/ 347
METRIC RANK
5.4%
DISABILITY AGE 5 TO 17
95.5/ 100
METRIC RATING
123rd/ 347
METRIC RANK
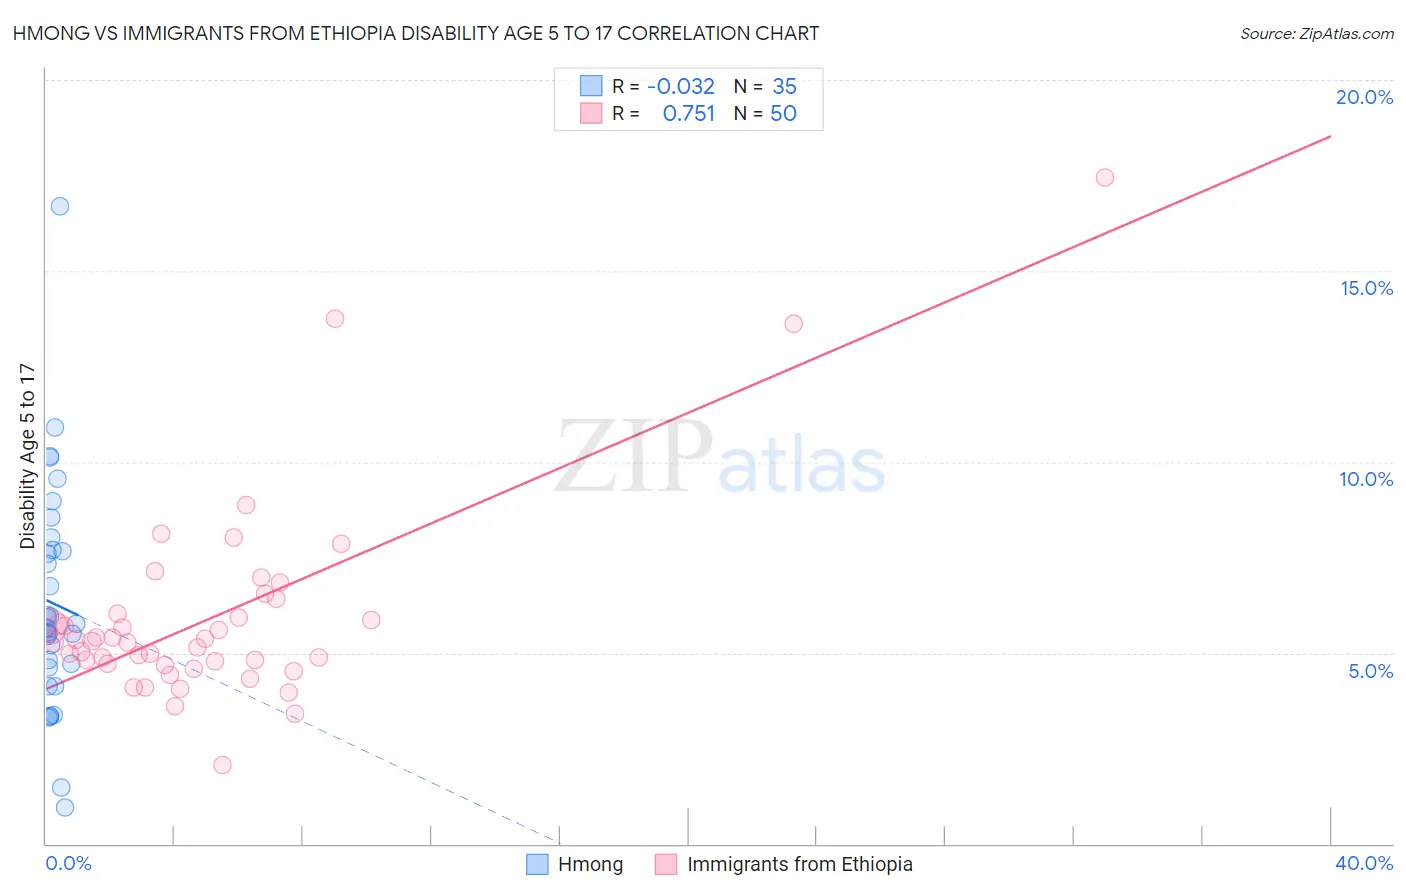
Hmong vs Immigrants from Ethiopia Disability Age 5 to 17 Correlation Chart
The statistical analysis conducted on geographies consisting of 24,665,493 people shows no correlation between the proportion of Hmong and percentage of population with a disability between the ages 5 and 17 in the United States with a correlation coefficient (R) of -0.032 and weighted average of 6.3%. Similarly, the statistical analysis conducted on geographies consisting of 210,785,168 people shows a strong positive correlation between the proportion of Immigrants from Ethiopia and percentage of population with a disability between the ages 5 and 17 in the United States with a correlation coefficient (R) of 0.751 and weighted average of 5.4%, a difference of 17.6%.
Disability Age 5 to 17 Correlation Summary
| Measurement | Hmong | Immigrants from Ethiopia |
| Minimum | 0.96% | 2.1% |
| Maximum | 16.7% | 17.5% |
| Range | 15.7% | 15.4% |
| Mean | 6.3% | 5.9% |
| Median | 5.7% | 5.3% |
| Interquartile 25% (IQ1) | 4.6% | 4.7% |
| Interquartile 75% (IQ3) | 7.7% | 6.0% |
| Interquartile Range (IQR) | 3.1% | 1.3% |
| Standard Deviation (Sample) | 3.0% | 2.6% |
| Standard Deviation (Population) | 2.9% | 2.6% |
Similar Demographics by Disability Age 5 to 17
Demographics Similar to Hmong by Disability Age 5 to 17
In terms of disability age 5 to 17, the demographic groups most similar to Hmong are Scotch-Irish (6.3%, a difference of 0.020%), Alaskan Athabascan (6.3%, a difference of 0.13%), Immigrants from Dominica (6.3%, a difference of 0.18%), Bahamian (6.3%, a difference of 0.26%), and Bermudan (6.4%, a difference of 0.29%).
| Demographics | Rating | Rank | Disability Age 5 to 17 |
| Celtics | 0.0 /100 | #302 | Tragic 6.3% |
| Yakama | 0.0 /100 | #303 | Tragic 6.3% |
| Senegalese | 0.0 /100 | #304 | Tragic 6.3% |
| Natives/Alaskans | 0.0 /100 | #305 | Tragic 6.3% |
| Immigrants | Nonimmigrants | 0.0 /100 | #306 | Tragic 6.3% |
| Bahamians | 0.0 /100 | #307 | Tragic 6.3% |
| Scotch-Irish | 0.0 /100 | #308 | Tragic 6.3% |
| Hmong | 0.0 /100 | #309 | Tragic 6.3% |
| Alaskan Athabascans | 0.0 /100 | #310 | Tragic 6.3% |
| Immigrants | Dominica | 0.0 /100 | #311 | Tragic 6.3% |
| Bermudans | 0.0 /100 | #312 | Tragic 6.4% |
| Apache | 0.0 /100 | #313 | Tragic 6.4% |
| French | 0.0 /100 | #314 | Tragic 6.4% |
| Immigrants | Portugal | 0.0 /100 | #315 | Tragic 6.4% |
| Immigrants | Dominican Republic | 0.0 /100 | #316 | Tragic 6.4% |
Demographics Similar to Immigrants from Ethiopia by Disability Age 5 to 17
In terms of disability age 5 to 17, the demographic groups most similar to Immigrants from Ethiopia are Chilean (5.4%, a difference of 0.10%), Crow (5.4%, a difference of 0.13%), Immigrants from Chile (5.4%, a difference of 0.15%), Maltese (5.4%, a difference of 0.16%), and New Zealander (5.4%, a difference of 0.16%).
| Demographics | Rating | Rank | Disability Age 5 to 17 |
| Cypriots | 97.7 /100 | #116 | Exceptional 5.3% |
| Immigrants | Afghanistan | 97.4 /100 | #117 | Exceptional 5.3% |
| South Americans | 97.1 /100 | #118 | Exceptional 5.4% |
| Immigrants | South America | 97.1 /100 | #119 | Exceptional 5.4% |
| Immigrants | Immigrants | 97.0 /100 | #120 | Exceptional 5.4% |
| Maltese | 96.0 /100 | #121 | Exceptional 5.4% |
| Chileans | 95.8 /100 | #122 | Exceptional 5.4% |
| Immigrants | Ethiopia | 95.5 /100 | #123 | Exceptional 5.4% |
| Crow | 95.0 /100 | #124 | Exceptional 5.4% |
| Immigrants | Chile | 95.0 /100 | #125 | Exceptional 5.4% |
| New Zealanders | 95.0 /100 | #126 | Exceptional 5.4% |
| Latvians | 95.0 /100 | #127 | Exceptional 5.4% |
| Immigrants | Venezuela | 94.5 /100 | #128 | Exceptional 5.4% |
| Romanians | 94.1 /100 | #129 | Exceptional 5.4% |
| Immigrants | Bulgaria | 94.0 /100 | #130 | Exceptional 5.4% |