Blackfeet vs Immigrants from Nigeria Male Disability
COMPARE
Blackfeet
Immigrants from Nigeria
Male Disability
Male Disability Comparison
Blackfeet
Immigrants from Nigeria
13.4%
MALE DISABILITY
0.0/ 100
METRIC RATING
309th/ 347
METRIC RANK
10.8%
MALE DISABILITY
95.1/ 100
METRIC RATING
104th/ 347
METRIC RANK
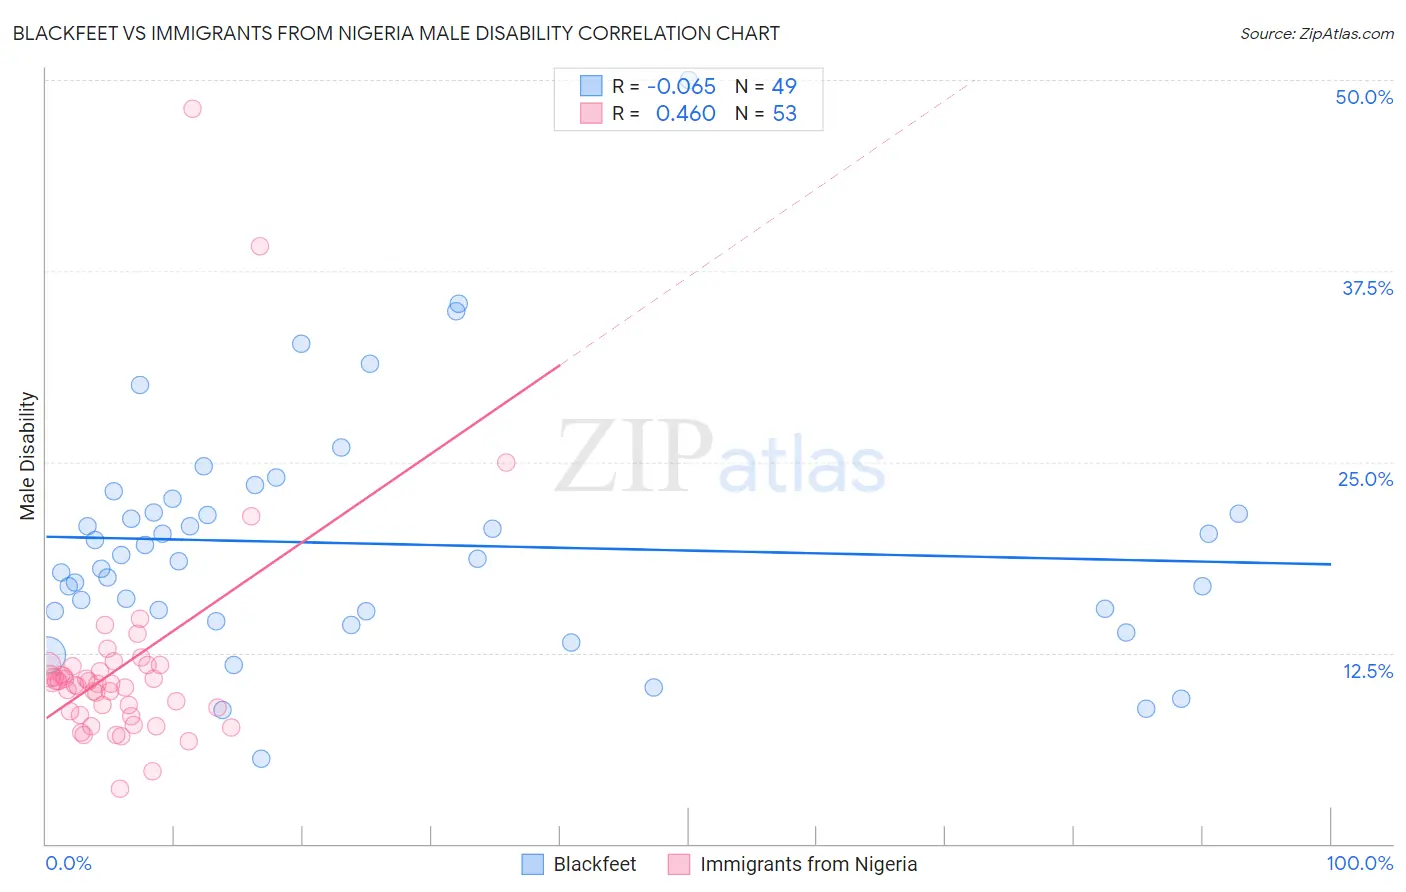
Blackfeet vs Immigrants from Nigeria Male Disability Correlation Chart
The statistical analysis conducted on geographies consisting of 309,505,092 people shows a slight negative correlation between the proportion of Blackfeet and percentage of males with a disability in the United States with a correlation coefficient (R) of -0.065 and weighted average of 13.4%. Similarly, the statistical analysis conducted on geographies consisting of 283,467,451 people shows a moderate positive correlation between the proportion of Immigrants from Nigeria and percentage of males with a disability in the United States with a correlation coefficient (R) of 0.460 and weighted average of 10.8%, a difference of 24.7%.
Male Disability Correlation Summary
| Measurement | Blackfeet | Immigrants from Nigeria |
| Minimum | 5.6% | 3.6% |
| Maximum | 50.0% | 48.1% |
| Range | 44.4% | 44.5% |
| Mean | 19.6% | 11.7% |
| Median | 18.6% | 10.5% |
| Interquartile 25% (IQ1) | 15.2% | 8.5% |
| Interquartile 75% (IQ3) | 22.2% | 11.6% |
| Interquartile Range (IQR) | 6.9% | 3.1% |
| Standard Deviation (Sample) | 7.9% | 7.3% |
| Standard Deviation (Population) | 7.8% | 7.2% |
Similar Demographics by Male Disability
Demographics Similar to Blackfeet by Male Disability
In terms of male disability, the demographic groups most similar to Blackfeet are Immigrants from the Azores (13.4%, a difference of 0.14%), Delaware (13.5%, a difference of 0.33%), French American Indian (13.4%, a difference of 0.42%), Arapaho (13.3%, a difference of 0.58%), and Spanish American (13.3%, a difference of 0.80%).
| Demographics | Rating | Rank | Male Disability |
| Crow | 0.0 /100 | #302 | Tragic 13.1% |
| Scotch-Irish | 0.0 /100 | #303 | Tragic 13.2% |
| Blacks/African Americans | 0.0 /100 | #304 | Tragic 13.2% |
| French Canadians | 0.0 /100 | #305 | Tragic 13.3% |
| Spanish Americans | 0.0 /100 | #306 | Tragic 13.3% |
| Arapaho | 0.0 /100 | #307 | Tragic 13.3% |
| French American Indians | 0.0 /100 | #308 | Tragic 13.4% |
| Blackfeet | 0.0 /100 | #309 | Tragic 13.4% |
| Immigrants | Azores | 0.0 /100 | #310 | Tragic 13.4% |
| Delaware | 0.0 /100 | #311 | Tragic 13.5% |
| Yakama | 0.0 /100 | #312 | Tragic 13.5% |
| Puget Sound Salish | 0.0 /100 | #313 | Tragic 13.5% |
| Aleuts | 0.0 /100 | #314 | Tragic 13.5% |
| Iroquois | 0.0 /100 | #315 | Tragic 13.6% |
| Alaska Natives | 0.0 /100 | #316 | Tragic 13.6% |
Demographics Similar to Immigrants from Nigeria by Male Disability
In terms of male disability, the demographic groups most similar to Immigrants from Nigeria are Immigrants from Brazil (10.8%, a difference of 0.010%), Uruguayan (10.7%, a difference of 0.060%), Immigrants from Syria (10.8%, a difference of 0.060%), Immigrants from Eastern Europe (10.7%, a difference of 0.080%), and Immigrants from Greece (10.7%, a difference of 0.17%).
| Demographics | Rating | Rank | Male Disability |
| Immigrants | Armenia | 96.6 /100 | #97 | Exceptional 10.7% |
| Immigrants | Romania | 96.5 /100 | #98 | Exceptional 10.7% |
| Immigrants | Switzerland | 96.1 /100 | #99 | Exceptional 10.7% |
| Immigrants | Kazakhstan | 95.9 /100 | #100 | Exceptional 10.7% |
| Immigrants | Greece | 95.6 /100 | #101 | Exceptional 10.7% |
| Immigrants | Eastern Europe | 95.3 /100 | #102 | Exceptional 10.7% |
| Uruguayans | 95.3 /100 | #103 | Exceptional 10.7% |
| Immigrants | Nigeria | 95.1 /100 | #104 | Exceptional 10.8% |
| Immigrants | Brazil | 95.0 /100 | #105 | Exceptional 10.8% |
| Immigrants | Syria | 94.9 /100 | #106 | Exceptional 10.8% |
| Immigrants | Eastern Africa | 94.3 /100 | #107 | Exceptional 10.8% |
| Immigrants | Belgium | 94.2 /100 | #108 | Exceptional 10.8% |
| Immigrants | Uganda | 94.0 /100 | #109 | Exceptional 10.8% |
| Immigrants | Immigrants | 93.9 /100 | #110 | Exceptional 10.8% |
| Immigrants | Uruguay | 93.8 /100 | #111 | Exceptional 10.8% |