Blackfeet vs Immigrants from Lithuania Male Disability
COMPARE
Blackfeet
Immigrants from Lithuania
Male Disability
Male Disability Comparison
Blackfeet
Immigrants from Lithuania
13.4%
MALE DISABILITY
0.0/ 100
METRIC RATING
309th/ 347
METRIC RANK
10.5%
MALE DISABILITY
98.9/ 100
METRIC RATING
73rd/ 347
METRIC RANK
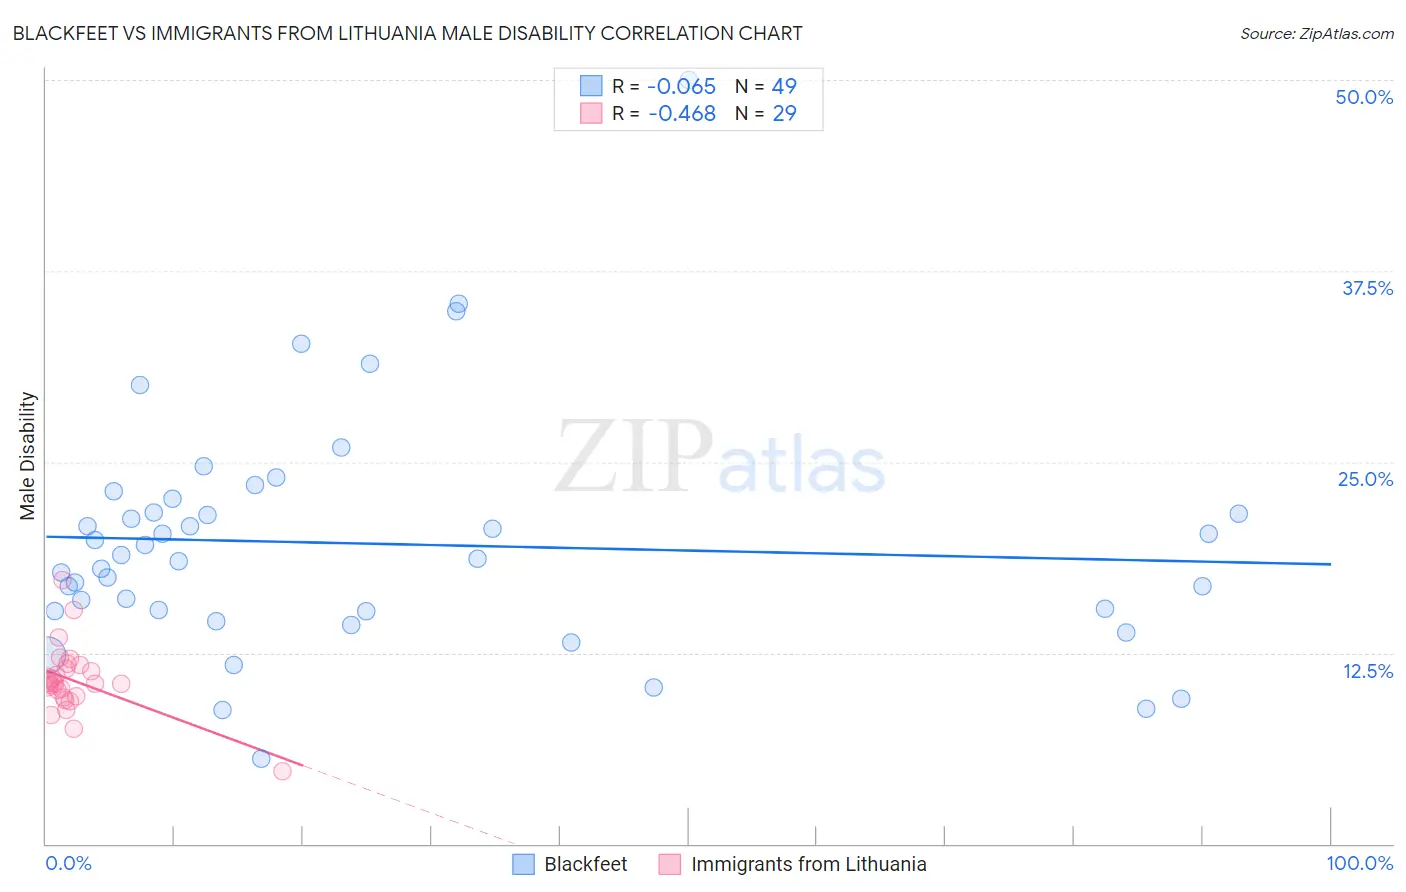
Blackfeet vs Immigrants from Lithuania Male Disability Correlation Chart
The statistical analysis conducted on geographies consisting of 309,505,092 people shows a slight negative correlation between the proportion of Blackfeet and percentage of males with a disability in the United States with a correlation coefficient (R) of -0.065 and weighted average of 13.4%. Similarly, the statistical analysis conducted on geographies consisting of 117,723,039 people shows a moderate negative correlation between the proportion of Immigrants from Lithuania and percentage of males with a disability in the United States with a correlation coefficient (R) of -0.468 and weighted average of 10.5%, a difference of 27.6%.
Male Disability Correlation Summary
| Measurement | Blackfeet | Immigrants from Lithuania |
| Minimum | 5.6% | 4.7% |
| Maximum | 50.0% | 17.2% |
| Range | 44.4% | 12.5% |
| Mean | 19.6% | 10.7% |
| Median | 18.6% | 10.5% |
| Interquartile 25% (IQ1) | 15.2% | 9.6% |
| Interquartile 75% (IQ3) | 22.2% | 11.6% |
| Interquartile Range (IQR) | 6.9% | 2.0% |
| Standard Deviation (Sample) | 7.9% | 2.2% |
| Standard Deviation (Population) | 7.8% | 2.2% |
Similar Demographics by Male Disability
Demographics Similar to Blackfeet by Male Disability
In terms of male disability, the demographic groups most similar to Blackfeet are Immigrants from the Azores (13.4%, a difference of 0.14%), Delaware (13.5%, a difference of 0.33%), French American Indian (13.4%, a difference of 0.42%), Arapaho (13.3%, a difference of 0.58%), and Spanish American (13.3%, a difference of 0.80%).
| Demographics | Rating | Rank | Male Disability |
| Crow | 0.0 /100 | #302 | Tragic 13.1% |
| Scotch-Irish | 0.0 /100 | #303 | Tragic 13.2% |
| Blacks/African Americans | 0.0 /100 | #304 | Tragic 13.2% |
| French Canadians | 0.0 /100 | #305 | Tragic 13.3% |
| Spanish Americans | 0.0 /100 | #306 | Tragic 13.3% |
| Arapaho | 0.0 /100 | #307 | Tragic 13.3% |
| French American Indians | 0.0 /100 | #308 | Tragic 13.4% |
| Blackfeet | 0.0 /100 | #309 | Tragic 13.4% |
| Immigrants | Azores | 0.0 /100 | #310 | Tragic 13.4% |
| Delaware | 0.0 /100 | #311 | Tragic 13.5% |
| Yakama | 0.0 /100 | #312 | Tragic 13.5% |
| Puget Sound Salish | 0.0 /100 | #313 | Tragic 13.5% |
| Aleuts | 0.0 /100 | #314 | Tragic 13.5% |
| Iroquois | 0.0 /100 | #315 | Tragic 13.6% |
| Alaska Natives | 0.0 /100 | #316 | Tragic 13.6% |
Demographics Similar to Immigrants from Lithuania by Male Disability
In terms of male disability, the demographic groups most similar to Immigrants from Lithuania are Immigrants from Serbia (10.5%, a difference of 0.060%), Immigrants from Cameroon (10.5%, a difference of 0.12%), Immigrants from Lebanon (10.5%, a difference of 0.14%), Sierra Leonean (10.5%, a difference of 0.26%), and Immigrants from Bulgaria (10.5%, a difference of 0.27%).
| Demographics | Rating | Rank | Male Disability |
| Guyanese | 99.2 /100 | #66 | Exceptional 10.5% |
| Immigrants | Afghanistan | 99.2 /100 | #67 | Exceptional 10.5% |
| Colombians | 99.2 /100 | #68 | Exceptional 10.5% |
| Ecuadorians | 99.2 /100 | #69 | Exceptional 10.5% |
| Immigrants | Bulgaria | 99.1 /100 | #70 | Exceptional 10.5% |
| Immigrants | Cameroon | 99.0 /100 | #71 | Exceptional 10.5% |
| Immigrants | Serbia | 99.0 /100 | #72 | Exceptional 10.5% |
| Immigrants | Lithuania | 98.9 /100 | #73 | Exceptional 10.5% |
| Immigrants | Lebanon | 98.8 /100 | #74 | Exceptional 10.5% |
| Sierra Leoneans | 98.7 /100 | #75 | Exceptional 10.5% |
| Immigrants | Sierra Leone | 98.7 /100 | #76 | Exceptional 10.5% |
| Laotians | 98.6 /100 | #77 | Exceptional 10.6% |
| Immigrants | Russia | 98.6 /100 | #78 | Exceptional 10.6% |
| Zimbabweans | 98.4 /100 | #79 | Exceptional 10.6% |
| Immigrants | Jordan | 98.4 /100 | #80 | Exceptional 10.6% |