Blackfeet vs Apache Median Earnings
COMPARE
Blackfeet
Apache
Median Earnings
Median Earnings Comparison
Blackfeet
Apache
$41,822
MEDIAN EARNINGS
0.2/ 100
METRIC RATING
284th/ 347
METRIC RANK
$40,388
MEDIAN EARNINGS
0.0/ 100
METRIC RATING
310th/ 347
METRIC RANK
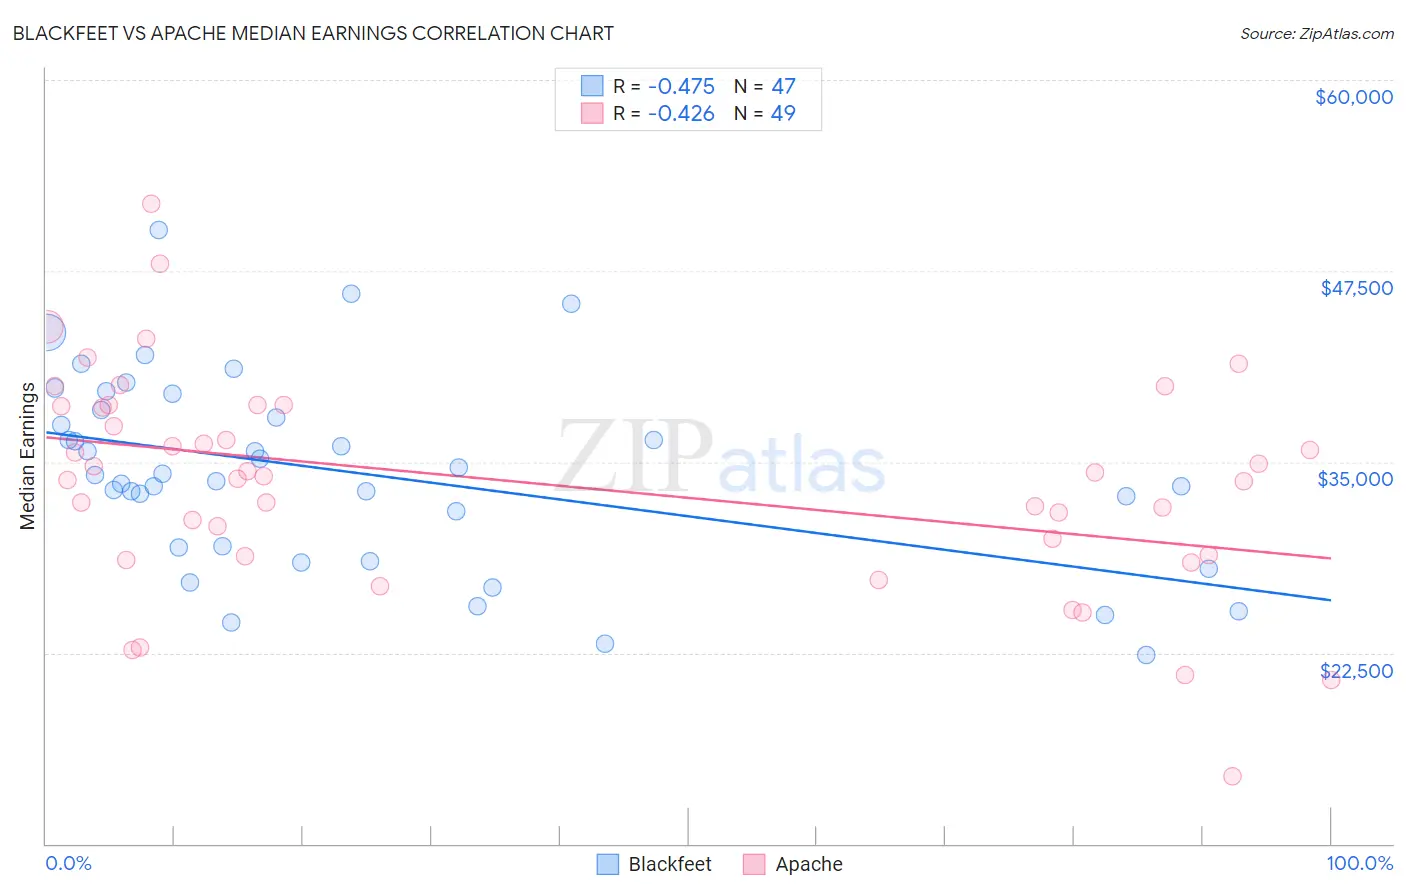
Blackfeet vs Apache Median Earnings Correlation Chart
The statistical analysis conducted on geographies consisting of 309,547,569 people shows a moderate negative correlation between the proportion of Blackfeet and median earnings in the United States with a correlation coefficient (R) of -0.475 and weighted average of $41,822. Similarly, the statistical analysis conducted on geographies consisting of 231,119,863 people shows a moderate negative correlation between the proportion of Apache and median earnings in the United States with a correlation coefficient (R) of -0.426 and weighted average of $40,388, a difference of 3.5%.
Median Earnings Correlation Summary
| Measurement | Blackfeet | Apache |
| Minimum | $22,344 | $14,458 |
| Maximum | $50,156 | $51,892 |
| Range | $27,812 | $37,433 |
| Mean | $34,283 | $33,634 |
| Median | $34,137 | $34,056 |
| Interquartile 25% (IQ1) | $29,375 | $28,886 |
| Interquartile 75% (IQ3) | $38,433 | $38,705 |
| Interquartile Range (IQR) | $9,058 | $9,819 |
| Standard Deviation (Sample) | $6,292 | $7,141 |
| Standard Deviation (Population) | $6,225 | $7,068 |
Similar Demographics by Median Earnings
Demographics Similar to Blackfeet by Median Earnings
In terms of median earnings, the demographic groups most similar to Blackfeet are Dominican ($41,864, a difference of 0.10%), Immigrants from Nicaragua ($41,737, a difference of 0.20%), Mexican American Indian ($41,719, a difference of 0.25%), Indonesian ($41,701, a difference of 0.29%), and African ($41,955, a difference of 0.32%).
| Demographics | Rating | Rank | Median Earnings |
| Central Americans | 0.3 /100 | #277 | Tragic $42,280 |
| Cajuns | 0.3 /100 | #278 | Tragic $42,189 |
| Colville | 0.2 /100 | #279 | Tragic $42,151 |
| Hmong | 0.2 /100 | #280 | Tragic $42,111 |
| Marshallese | 0.2 /100 | #281 | Tragic $41,969 |
| Africans | 0.2 /100 | #282 | Tragic $41,955 |
| Dominicans | 0.2 /100 | #283 | Tragic $41,864 |
| Blackfeet | 0.2 /100 | #284 | Tragic $41,822 |
| Immigrants | Nicaragua | 0.1 /100 | #285 | Tragic $41,737 |
| Mexican American Indians | 0.1 /100 | #286 | Tragic $41,719 |
| Indonesians | 0.1 /100 | #287 | Tragic $41,701 |
| Immigrants | Dominican Republic | 0.1 /100 | #288 | Tragic $41,554 |
| Comanche | 0.1 /100 | #289 | Tragic $41,519 |
| Paiute | 0.1 /100 | #290 | Tragic $41,508 |
| Central American Indians | 0.1 /100 | #291 | Tragic $41,474 |
Demographics Similar to Apache by Median Earnings
In terms of median earnings, the demographic groups most similar to Apache are Hispanic or Latino ($40,288, a difference of 0.25%), Chippewa ($40,287, a difference of 0.25%), Choctaw ($40,270, a difference of 0.29%), Cheyenne ($40,233, a difference of 0.39%), and Seminole ($40,233, a difference of 0.39%).
| Demographics | Rating | Rank | Median Earnings |
| Haitians | 0.0 /100 | #303 | Tragic $40,918 |
| Immigrants | Guatemala | 0.0 /100 | #304 | Tragic $40,851 |
| Chickasaw | 0.0 /100 | #305 | Tragic $40,672 |
| Yaqui | 0.0 /100 | #306 | Tragic $40,647 |
| Hondurans | 0.0 /100 | #307 | Tragic $40,638 |
| Cubans | 0.0 /100 | #308 | Tragic $40,619 |
| Immigrants | Haiti | 0.0 /100 | #309 | Tragic $40,550 |
| Apache | 0.0 /100 | #310 | Tragic $40,388 |
| Hispanics or Latinos | 0.0 /100 | #311 | Tragic $40,288 |
| Chippewa | 0.0 /100 | #312 | Tragic $40,287 |
| Choctaw | 0.0 /100 | #313 | Tragic $40,270 |
| Cheyenne | 0.0 /100 | #314 | Tragic $40,233 |
| Seminole | 0.0 /100 | #315 | Tragic $40,233 |
| Immigrants | Honduras | 0.0 /100 | #316 | Tragic $40,195 |
| Fijians | 0.0 /100 | #317 | Tragic $40,193 |