Blackfeet vs Samoan Male Disability
COMPARE
Blackfeet
Samoan
Male Disability
Male Disability Comparison
Blackfeet
Samoans
13.4%
MALE DISABILITY
0.0/ 100
METRIC RATING
309th/ 347
METRIC RANK
11.9%
MALE DISABILITY
1.1/ 100
METRIC RATING
243rd/ 347
METRIC RANK
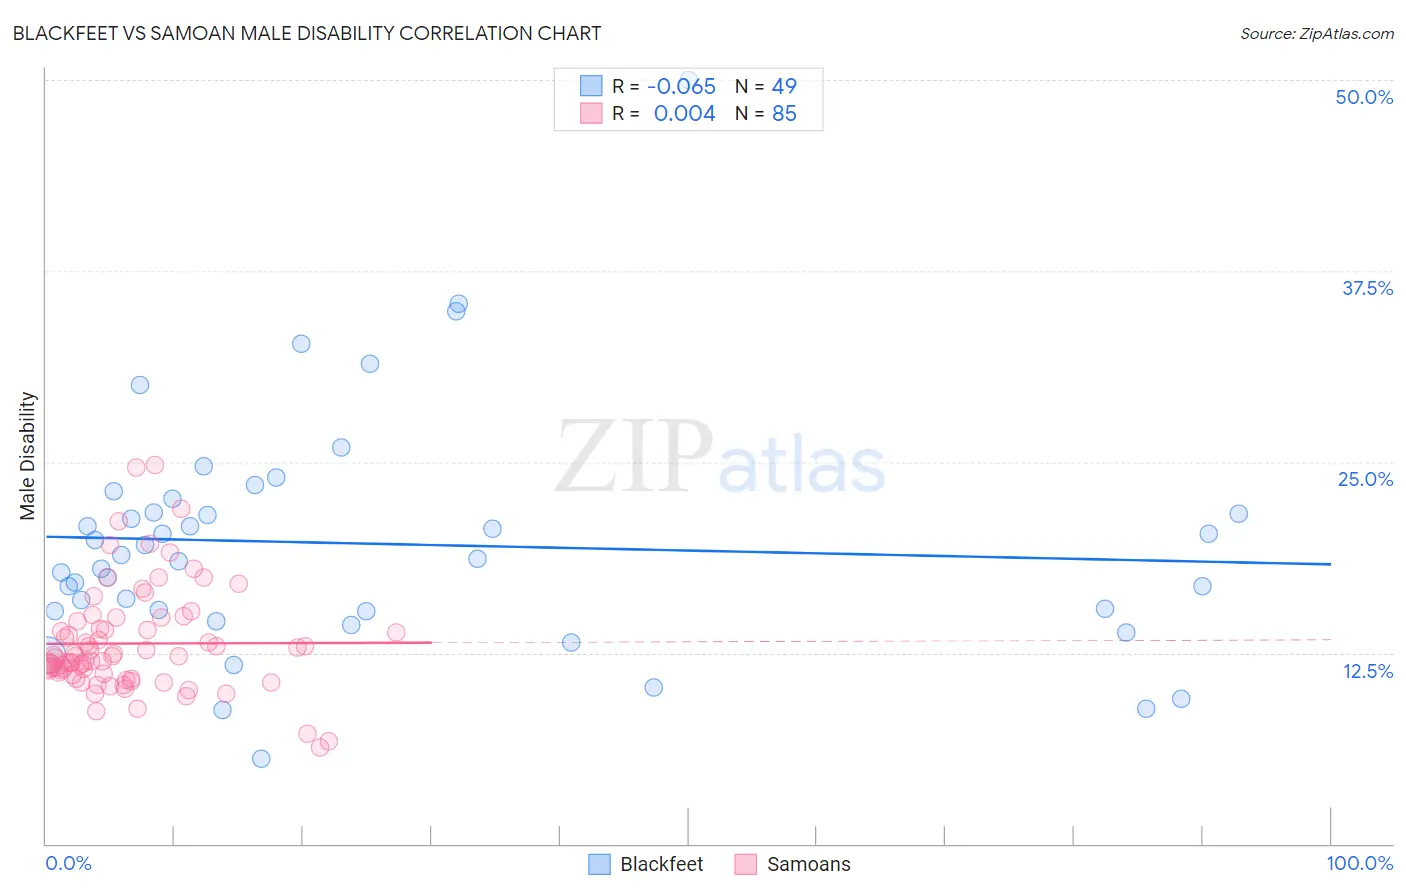
Blackfeet vs Samoan Male Disability Correlation Chart
The statistical analysis conducted on geographies consisting of 309,505,092 people shows a slight negative correlation between the proportion of Blackfeet and percentage of males with a disability in the United States with a correlation coefficient (R) of -0.065 and weighted average of 13.4%. Similarly, the statistical analysis conducted on geographies consisting of 225,113,160 people shows no correlation between the proportion of Samoans and percentage of males with a disability in the United States with a correlation coefficient (R) of 0.004 and weighted average of 11.9%, a difference of 12.6%.
Male Disability Correlation Summary
| Measurement | Blackfeet | Samoan |
| Minimum | 5.6% | 6.3% |
| Maximum | 50.0% | 24.8% |
| Range | 44.4% | 18.4% |
| Mean | 19.6% | 13.1% |
| Median | 18.6% | 12.2% |
| Interquartile 25% (IQ1) | 15.2% | 11.1% |
| Interquartile 75% (IQ3) | 22.2% | 14.3% |
| Interquartile Range (IQR) | 6.9% | 3.2% |
| Standard Deviation (Sample) | 7.9% | 3.5% |
| Standard Deviation (Population) | 7.8% | 3.5% |
Similar Demographics by Male Disability
Demographics Similar to Blackfeet by Male Disability
In terms of male disability, the demographic groups most similar to Blackfeet are Immigrants from the Azores (13.4%, a difference of 0.14%), Delaware (13.5%, a difference of 0.33%), French American Indian (13.4%, a difference of 0.42%), Arapaho (13.3%, a difference of 0.58%), and Spanish American (13.3%, a difference of 0.80%).
| Demographics | Rating | Rank | Male Disability |
| Crow | 0.0 /100 | #302 | Tragic 13.1% |
| Scotch-Irish | 0.0 /100 | #303 | Tragic 13.2% |
| Blacks/African Americans | 0.0 /100 | #304 | Tragic 13.2% |
| French Canadians | 0.0 /100 | #305 | Tragic 13.3% |
| Spanish Americans | 0.0 /100 | #306 | Tragic 13.3% |
| Arapaho | 0.0 /100 | #307 | Tragic 13.3% |
| French American Indians | 0.0 /100 | #308 | Tragic 13.4% |
| Blackfeet | 0.0 /100 | #309 | Tragic 13.4% |
| Immigrants | Azores | 0.0 /100 | #310 | Tragic 13.4% |
| Delaware | 0.0 /100 | #311 | Tragic 13.5% |
| Yakama | 0.0 /100 | #312 | Tragic 13.5% |
| Puget Sound Salish | 0.0 /100 | #313 | Tragic 13.5% |
| Aleuts | 0.0 /100 | #314 | Tragic 13.5% |
| Iroquois | 0.0 /100 | #315 | Tragic 13.6% |
| Alaska Natives | 0.0 /100 | #316 | Tragic 13.6% |
Demographics Similar to Samoans by Male Disability
In terms of male disability, the demographic groups most similar to Samoans are Northern European (11.9%, a difference of 0.030%), Bahamian (11.9%, a difference of 0.040%), Czech (11.9%, a difference of 0.080%), Immigrants from Laos (11.9%, a difference of 0.11%), and Immigrants from Liberia (11.9%, a difference of 0.12%).
| Demographics | Rating | Rank | Male Disability |
| U.S. Virgin Islanders | 1.3 /100 | #236 | Tragic 11.9% |
| Carpatho Rusyns | 1.3 /100 | #237 | Tragic 11.9% |
| Yugoslavians | 1.2 /100 | #238 | Tragic 11.9% |
| Italians | 1.2 /100 | #239 | Tragic 11.9% |
| Czechs | 1.1 /100 | #240 | Tragic 11.9% |
| Bahamians | 1.1 /100 | #241 | Tragic 11.9% |
| Northern Europeans | 1.1 /100 | #242 | Tragic 11.9% |
| Samoans | 1.1 /100 | #243 | Tragic 11.9% |
| Immigrants | Laos | 1.0 /100 | #244 | Tragic 11.9% |
| Immigrants | Liberia | 1.0 /100 | #245 | Tragic 11.9% |
| Danes | 0.9 /100 | #246 | Tragic 11.9% |
| Hungarians | 0.8 /100 | #247 | Tragic 12.0% |
| Poles | 0.7 /100 | #248 | Tragic 12.0% |
| Immigrants | Yemen | 0.5 /100 | #249 | Tragic 12.0% |
| Bangladeshis | 0.5 /100 | #250 | Tragic 12.0% |