Bhutanese vs Immigrants from Vietnam Disability
COMPARE
Bhutanese
Immigrants from Vietnam
Disability
Disability Comparison
Bhutanese
Immigrants from Vietnam
11.2%
DISABILITY
97.4/ 100
METRIC RATING
97th/ 347
METRIC RANK
11.0%
DISABILITY
99.4/ 100
METRIC RATING
75th/ 347
METRIC RANK
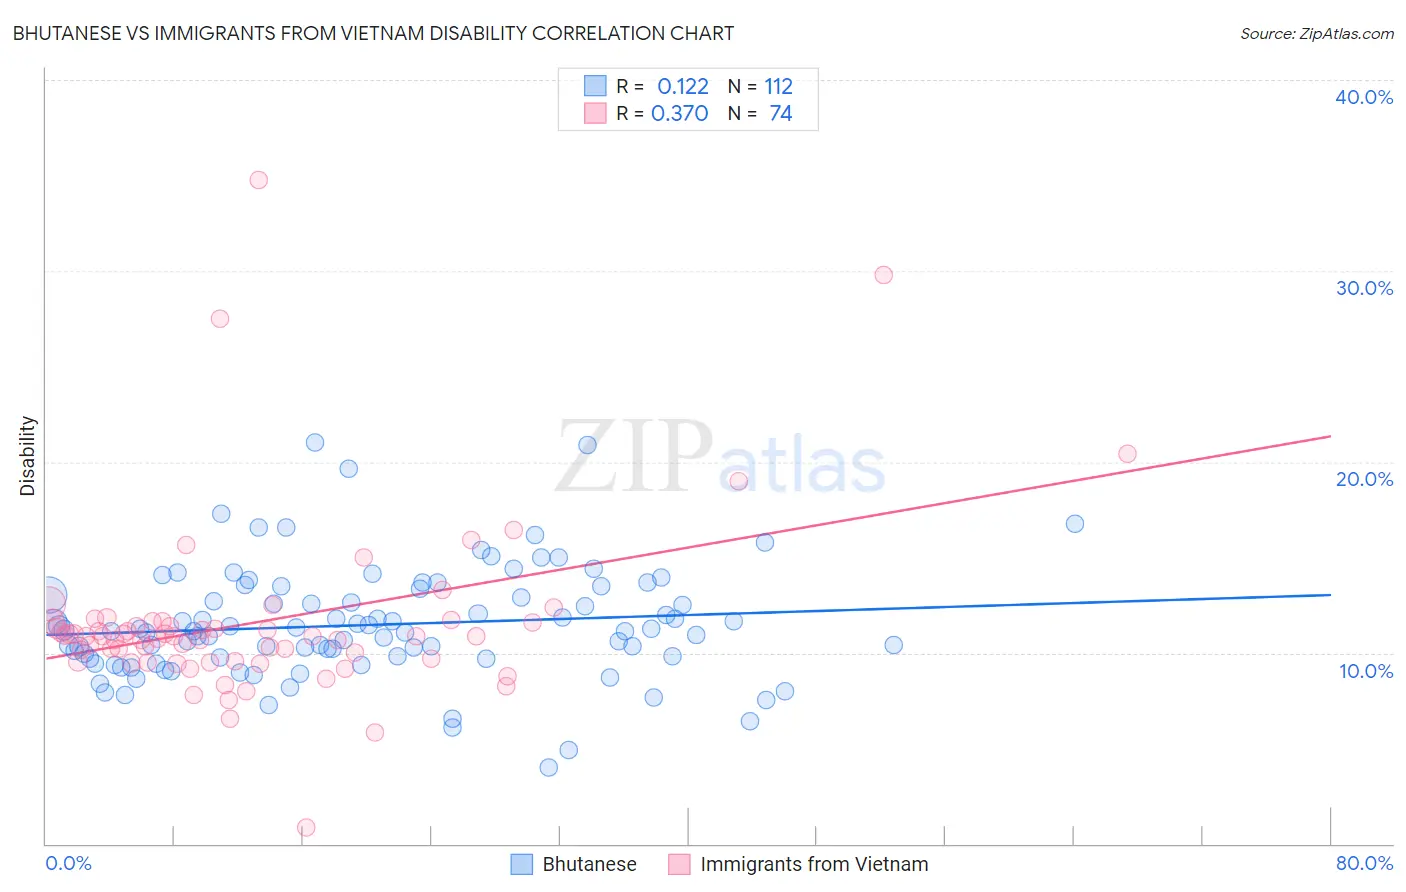
Bhutanese vs Immigrants from Vietnam Disability Correlation Chart
The statistical analysis conducted on geographies consisting of 455,521,093 people shows a poor positive correlation between the proportion of Bhutanese and percentage of population with a disability in the United States with a correlation coefficient (R) of 0.122 and weighted average of 11.2%. Similarly, the statistical analysis conducted on geographies consisting of 404,777,334 people shows a mild positive correlation between the proportion of Immigrants from Vietnam and percentage of population with a disability in the United States with a correlation coefficient (R) of 0.370 and weighted average of 11.0%, a difference of 1.7%.
Disability Correlation Summary
| Measurement | Bhutanese | Immigrants from Vietnam |
| Minimum | 4.0% | 0.87% |
| Maximum | 21.0% | 34.7% |
| Range | 17.0% | 33.9% |
| Mean | 11.5% | 11.6% |
| Median | 11.2% | 10.9% |
| Interquartile 25% (IQ1) | 9.7% | 9.6% |
| Interquartile 75% (IQ3) | 13.2% | 11.6% |
| Interquartile Range (IQR) | 3.5% | 2.0% |
| Standard Deviation (Sample) | 2.9% | 4.8% |
| Standard Deviation (Population) | 2.9% | 4.7% |
Similar Demographics by Disability
Demographics Similar to Bhutanese by Disability
In terms of disability, the demographic groups most similar to Bhutanese are Uruguayan (11.2%, a difference of 0.0%), Immigrants from Czechoslovakia (11.2%, a difference of 0.010%), Immigrants from Zimbabwe (11.2%, a difference of 0.14%), Immigrants from Greece (11.3%, a difference of 0.18%), and Immigrants from Morocco (11.2%, a difference of 0.21%).
| Demographics | Rating | Rank | Disability |
| Immigrants | Brazil | 98.1 /100 | #90 | Exceptional 11.2% |
| Immigrants | Western Asia | 98.1 /100 | #91 | Exceptional 11.2% |
| Ecuadorians | 98.0 /100 | #92 | Exceptional 11.2% |
| Immigrants | Ecuador | 98.0 /100 | #93 | Exceptional 11.2% |
| Immigrants | Morocco | 97.8 /100 | #94 | Exceptional 11.2% |
| Eastern Europeans | 97.8 /100 | #95 | Exceptional 11.2% |
| Immigrants | Zimbabwe | 97.7 /100 | #96 | Exceptional 11.2% |
| Bhutanese | 97.4 /100 | #97 | Exceptional 11.2% |
| Uruguayans | 97.4 /100 | #98 | Exceptional 11.2% |
| Immigrants | Czechoslovakia | 97.4 /100 | #99 | Exceptional 11.2% |
| Immigrants | Greece | 96.9 /100 | #100 | Exceptional 11.3% |
| Immigrants | Nicaragua | 96.8 /100 | #101 | Exceptional 11.3% |
| Immigrants | Eastern Africa | 96.7 /100 | #102 | Exceptional 11.3% |
| Immigrants | Uruguay | 96.4 /100 | #103 | Exceptional 11.3% |
| Immigrants | Immigrants | 96.4 /100 | #104 | Exceptional 11.3% |
Demographics Similar to Immigrants from Vietnam by Disability
In terms of disability, the demographic groups most similar to Immigrants from Vietnam are Immigrants from Serbia (11.0%, a difference of 0.020%), Sierra Leonean (11.0%, a difference of 0.030%), Immigrants from Belgium (11.0%, a difference of 0.030%), Immigrants from Bangladesh (11.0%, a difference of 0.040%), and Immigrants from Chile (11.0%, a difference of 0.070%).
| Demographics | Rating | Rank | Disability |
| Immigrants | Afghanistan | 99.6 /100 | #68 | Exceptional 11.0% |
| Sri Lankans | 99.5 /100 | #69 | Exceptional 11.0% |
| Immigrants | France | 99.4 /100 | #70 | Exceptional 11.0% |
| Immigrants | Lebanon | 99.4 /100 | #71 | Exceptional 11.0% |
| Immigrants | Chile | 99.4 /100 | #72 | Exceptional 11.0% |
| Immigrants | Bangladesh | 99.4 /100 | #73 | Exceptional 11.0% |
| Immigrants | Serbia | 99.4 /100 | #74 | Exceptional 11.0% |
| Immigrants | Vietnam | 99.4 /100 | #75 | Exceptional 11.0% |
| Sierra Leoneans | 99.3 /100 | #76 | Exceptional 11.0% |
| Immigrants | Belgium | 99.3 /100 | #77 | Exceptional 11.0% |
| Immigrants | Cameroon | 99.3 /100 | #78 | Exceptional 11.1% |
| Immigrants | Jordan | 99.3 /100 | #79 | Exceptional 11.1% |
| Immigrants | Ireland | 99.3 /100 | #80 | Exceptional 11.1% |
| Immigrants | Poland | 99.1 /100 | #81 | Exceptional 11.1% |
| Chileans | 99.1 /100 | #82 | Exceptional 11.1% |