Basque vs European Self-Care Disability
COMPARE
Basque
European
Self-Care Disability
Self-Care Disability Comparison
Basques
Europeans
2.4%
SELF-CARE DISABILITY
74.0/ 100
METRIC RATING
151st/ 347
METRIC RANK
2.4%
SELF-CARE DISABILITY
95.8/ 100
METRIC RATING
100th/ 347
METRIC RANK
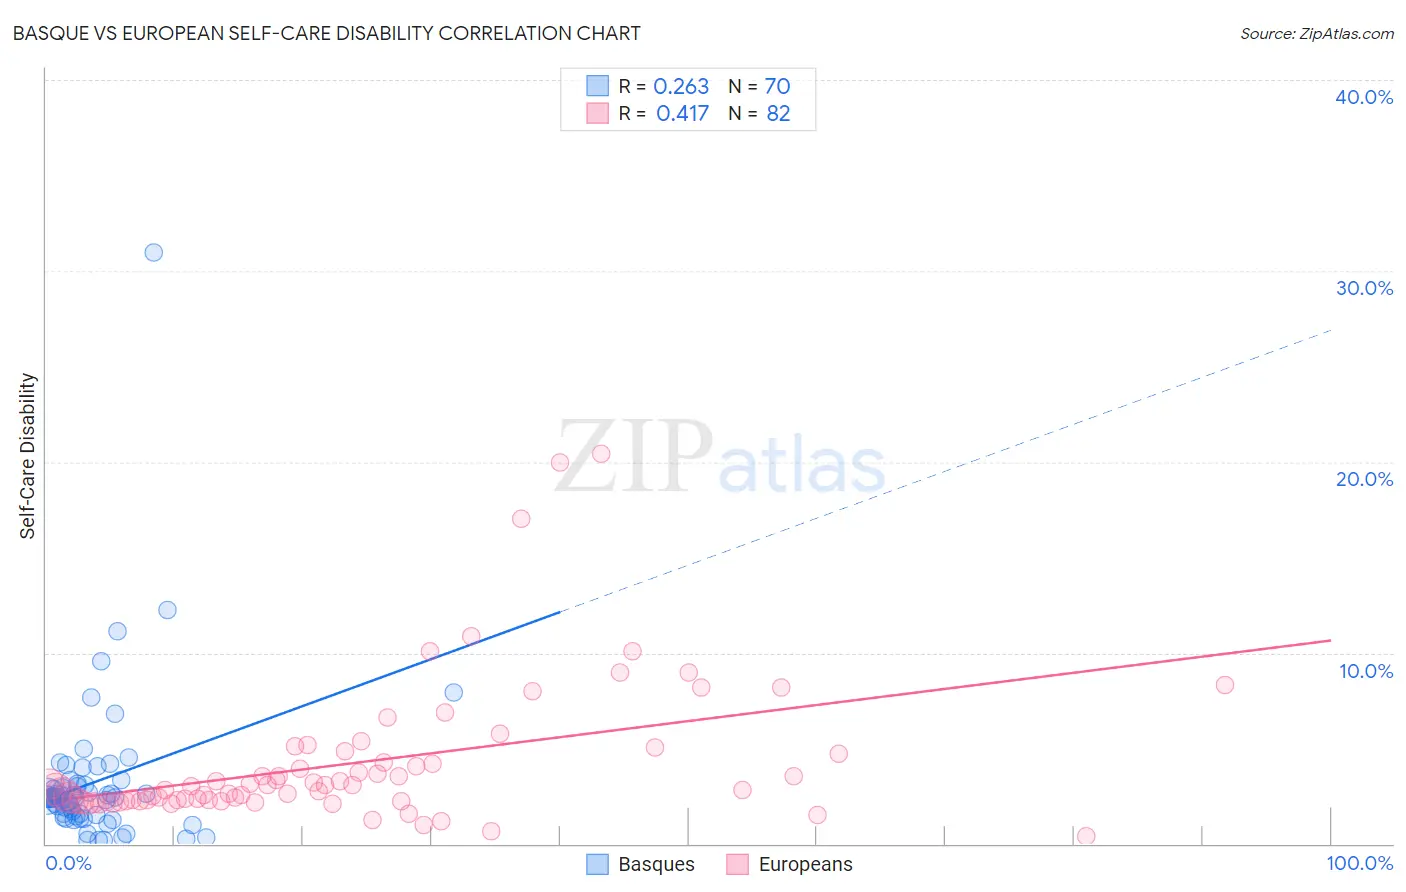
Basque vs European Self-Care Disability Correlation Chart
The statistical analysis conducted on geographies consisting of 165,703,684 people shows a weak positive correlation between the proportion of Basques and percentage of population with self-care disability in the United States with a correlation coefficient (R) of 0.263 and weighted average of 2.4%. Similarly, the statistical analysis conducted on geographies consisting of 559,811,147 people shows a moderate positive correlation between the proportion of Europeans and percentage of population with self-care disability in the United States with a correlation coefficient (R) of 0.417 and weighted average of 2.4%, a difference of 2.6%.
Self-Care Disability Correlation Summary
| Measurement | Basque | European |
| Minimum | 0.19% | 0.41% |
| Maximum | 31.0% | 20.5% |
| Range | 30.8% | 20.0% |
| Mean | 3.2% | 4.2% |
| Median | 2.4% | 2.9% |
| Interquartile 25% (IQ1) | 1.5% | 2.3% |
| Interquartile 75% (IQ3) | 3.1% | 4.7% |
| Interquartile Range (IQR) | 1.5% | 2.5% |
| Standard Deviation (Sample) | 4.1% | 3.7% |
| Standard Deviation (Population) | 4.1% | 3.7% |
Similar Demographics by Self-Care Disability
Demographics Similar to Basques by Self-Care Disability
In terms of self-care disability, the demographic groups most similar to Basques are Tlingit-Haida (2.4%, a difference of 0.030%), Immigrants from England (2.4%, a difference of 0.030%), Immigrants from Costa Rica (2.4%, a difference of 0.070%), Arab (2.4%, a difference of 0.11%), and Italian (2.4%, a difference of 0.11%).
| Demographics | Rating | Rank | Self-Care Disability |
| Costa Ricans | 80.8 /100 | #144 | Excellent 2.4% |
| Germans | 80.1 /100 | #145 | Excellent 2.4% |
| Israelis | 80.0 /100 | #146 | Good 2.4% |
| Dutch | 77.5 /100 | #147 | Good 2.4% |
| Romanians | 75.8 /100 | #148 | Good 2.4% |
| Arabs | 75.7 /100 | #149 | Good 2.4% |
| Immigrants | Costa Rica | 75.1 /100 | #150 | Good 2.4% |
| Basques | 74.0 /100 | #151 | Good 2.4% |
| Tlingit-Haida | 73.5 /100 | #152 | Good 2.4% |
| Immigrants | England | 73.5 /100 | #153 | Good 2.4% |
| Italians | 72.2 /100 | #154 | Good 2.4% |
| Pakistanis | 71.4 /100 | #155 | Good 2.4% |
| Nigerians | 70.6 /100 | #156 | Good 2.4% |
| Immigrants | Europe | 69.6 /100 | #157 | Good 2.4% |
| Immigrants | Western Europe | 68.6 /100 | #158 | Good 2.4% |
Demographics Similar to Europeans by Self-Care Disability
In terms of self-care disability, the demographic groups most similar to Europeans are Immigrants from Scotland (2.4%, a difference of 0.040%), Immigrants from Israel (2.4%, a difference of 0.10%), Immigrants from Poland (2.4%, a difference of 0.18%), Croatian (2.4%, a difference of 0.22%), and Alsatian (2.4%, a difference of 0.25%).
| Demographics | Rating | Rank | Self-Care Disability |
| Immigrants | Latvia | 97.0 /100 | #93 | Exceptional 2.4% |
| Macedonians | 96.9 /100 | #94 | Exceptional 2.4% |
| Immigrants | Asia | 96.9 /100 | #95 | Exceptional 2.4% |
| Immigrants | Chile | 96.7 /100 | #96 | Exceptional 2.4% |
| Swiss | 96.6 /100 | #97 | Exceptional 2.4% |
| Immigrants | Poland | 96.4 /100 | #98 | Exceptional 2.4% |
| Immigrants | Israel | 96.1 /100 | #99 | Exceptional 2.4% |
| Europeans | 95.8 /100 | #100 | Exceptional 2.4% |
| Immigrants | Scotland | 95.7 /100 | #101 | Exceptional 2.4% |
| Croatians | 95.0 /100 | #102 | Exceptional 2.4% |
| Alsatians | 94.9 /100 | #103 | Exceptional 2.4% |
| Bhutanese | 94.5 /100 | #104 | Exceptional 2.4% |
| Carpatho Rusyns | 94.4 /100 | #105 | Exceptional 2.4% |
| Immigrants | Indonesia | 94.3 /100 | #106 | Exceptional 2.4% |
| British | 94.3 /100 | #107 | Exceptional 2.4% |