Basque vs Norwegian Self-Care Disability
COMPARE
Basque
Norwegian
Self-Care Disability
Self-Care Disability Comparison
Basques
Norwegians
2.4%
SELF-CARE DISABILITY
74.0/ 100
METRIC RATING
151st/ 347
METRIC RANK
2.3%
SELF-CARE DISABILITY
99.8/ 100
METRIC RATING
45th/ 347
METRIC RANK
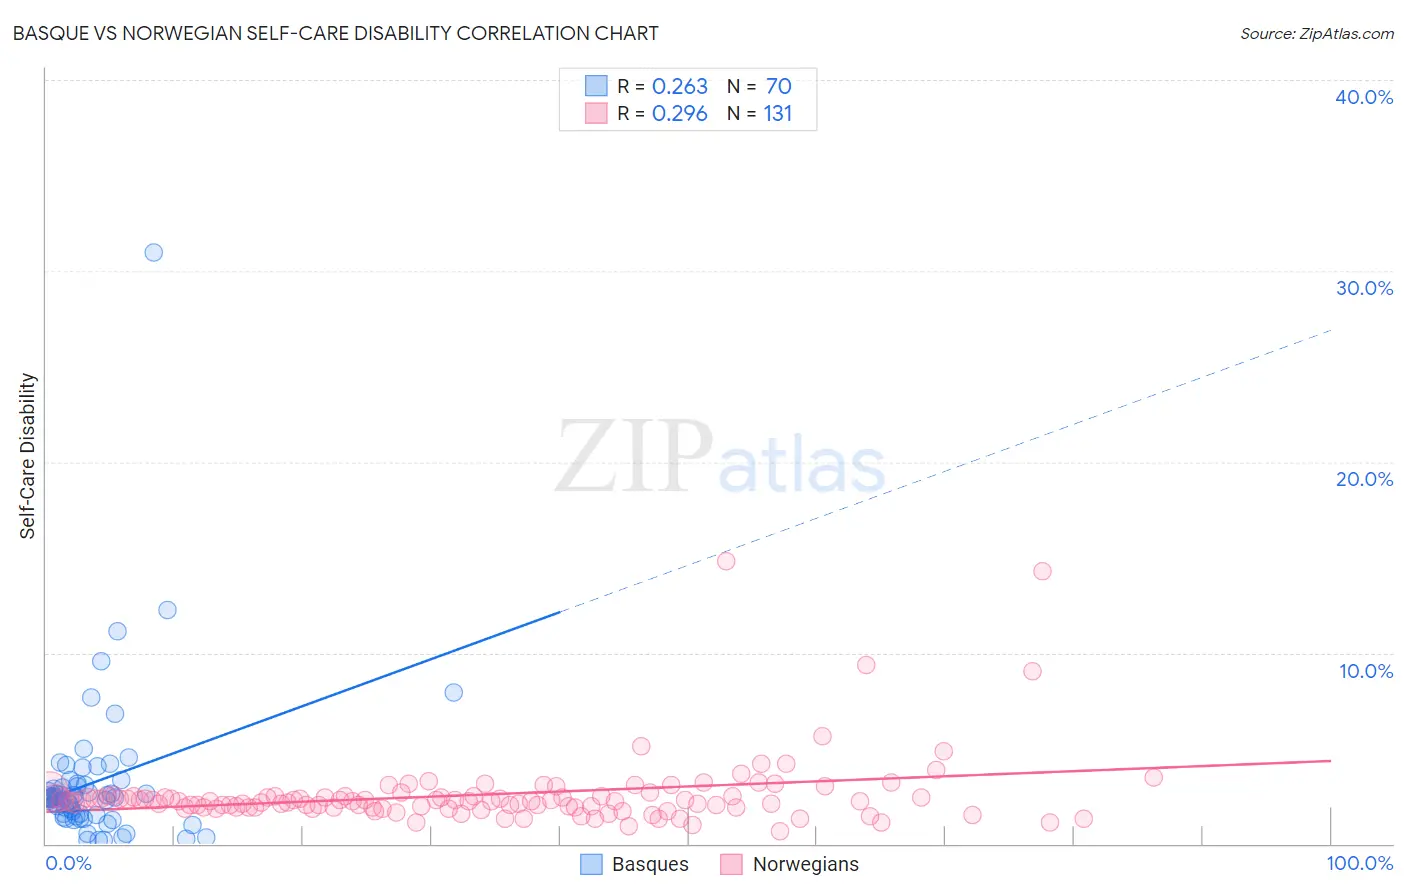
Basque vs Norwegian Self-Care Disability Correlation Chart
The statistical analysis conducted on geographies consisting of 165,703,684 people shows a weak positive correlation between the proportion of Basques and percentage of population with self-care disability in the United States with a correlation coefficient (R) of 0.263 and weighted average of 2.4%. Similarly, the statistical analysis conducted on geographies consisting of 531,593,682 people shows a weak positive correlation between the proportion of Norwegians and percentage of population with self-care disability in the United States with a correlation coefficient (R) of 0.296 and weighted average of 2.3%, a difference of 6.6%.
Self-Care Disability Correlation Summary
| Measurement | Basque | Norwegian |
| Minimum | 0.19% | 0.64% |
| Maximum | 31.0% | 14.8% |
| Range | 30.8% | 14.2% |
| Mean | 3.2% | 2.6% |
| Median | 2.4% | 2.2% |
| Interquartile 25% (IQ1) | 1.5% | 1.9% |
| Interquartile 75% (IQ3) | 3.1% | 2.5% |
| Interquartile Range (IQR) | 1.5% | 0.60% |
| Standard Deviation (Sample) | 4.1% | 1.9% |
| Standard Deviation (Population) | 4.1% | 1.9% |
Similar Demographics by Self-Care Disability
Demographics Similar to Basques by Self-Care Disability
In terms of self-care disability, the demographic groups most similar to Basques are Tlingit-Haida (2.4%, a difference of 0.030%), Immigrants from England (2.4%, a difference of 0.030%), Immigrants from Costa Rica (2.4%, a difference of 0.070%), Arab (2.4%, a difference of 0.11%), and Italian (2.4%, a difference of 0.11%).
| Demographics | Rating | Rank | Self-Care Disability |
| Costa Ricans | 80.8 /100 | #144 | Excellent 2.4% |
| Germans | 80.1 /100 | #145 | Excellent 2.4% |
| Israelis | 80.0 /100 | #146 | Good 2.4% |
| Dutch | 77.5 /100 | #147 | Good 2.4% |
| Romanians | 75.8 /100 | #148 | Good 2.4% |
| Arabs | 75.7 /100 | #149 | Good 2.4% |
| Immigrants | Costa Rica | 75.1 /100 | #150 | Good 2.4% |
| Basques | 74.0 /100 | #151 | Good 2.4% |
| Tlingit-Haida | 73.5 /100 | #152 | Good 2.4% |
| Immigrants | England | 73.5 /100 | #153 | Good 2.4% |
| Italians | 72.2 /100 | #154 | Good 2.4% |
| Pakistanis | 71.4 /100 | #155 | Good 2.4% |
| Nigerians | 70.6 /100 | #156 | Good 2.4% |
| Immigrants | Europe | 69.6 /100 | #157 | Good 2.4% |
| Immigrants | Western Europe | 68.6 /100 | #158 | Good 2.4% |
Demographics Similar to Norwegians by Self-Care Disability
In terms of self-care disability, the demographic groups most similar to Norwegians are Immigrants from South Africa (2.3%, a difference of 0.040%), Czech (2.3%, a difference of 0.080%), Immigrants from Pakistan (2.3%, a difference of 0.090%), Immigrants from Uganda (2.3%, a difference of 0.13%), and Immigrants from Sudan (2.3%, a difference of 0.23%).
| Demographics | Rating | Rank | Self-Care Disability |
| Immigrants | Eastern Africa | 99.9 /100 | #38 | Exceptional 2.3% |
| Immigrants | Bulgaria | 99.8 /100 | #39 | Exceptional 2.3% |
| Iranians | 99.8 /100 | #40 | Exceptional 2.3% |
| Immigrants | Sudan | 99.8 /100 | #41 | Exceptional 2.3% |
| Immigrants | Uganda | 99.8 /100 | #42 | Exceptional 2.3% |
| Immigrants | Pakistan | 99.8 /100 | #43 | Exceptional 2.3% |
| Immigrants | South Africa | 99.8 /100 | #44 | Exceptional 2.3% |
| Norwegians | 99.8 /100 | #45 | Exceptional 2.3% |
| Czechs | 99.8 /100 | #46 | Exceptional 2.3% |
| Jordanians | 99.7 /100 | #47 | Exceptional 2.3% |
| Immigrants | Malaysia | 99.7 /100 | #48 | Exceptional 2.3% |
| Latvians | 99.7 /100 | #49 | Exceptional 2.3% |
| Immigrants | Brazil | 99.7 /100 | #50 | Exceptional 2.3% |
| Kenyans | 99.7 /100 | #51 | Exceptional 2.3% |
| Immigrants | Serbia | 99.6 /100 | #52 | Exceptional 2.3% |