Basque vs Portuguese Self-Care Disability
COMPARE
Basque
Portuguese
Self-Care Disability
Self-Care Disability Comparison
Basques
Portuguese
2.4%
SELF-CARE DISABILITY
74.0/ 100
METRIC RATING
151st/ 347
METRIC RANK
2.6%
SELF-CARE DISABILITY
0.4/ 100
METRIC RATING
250th/ 347
METRIC RANK
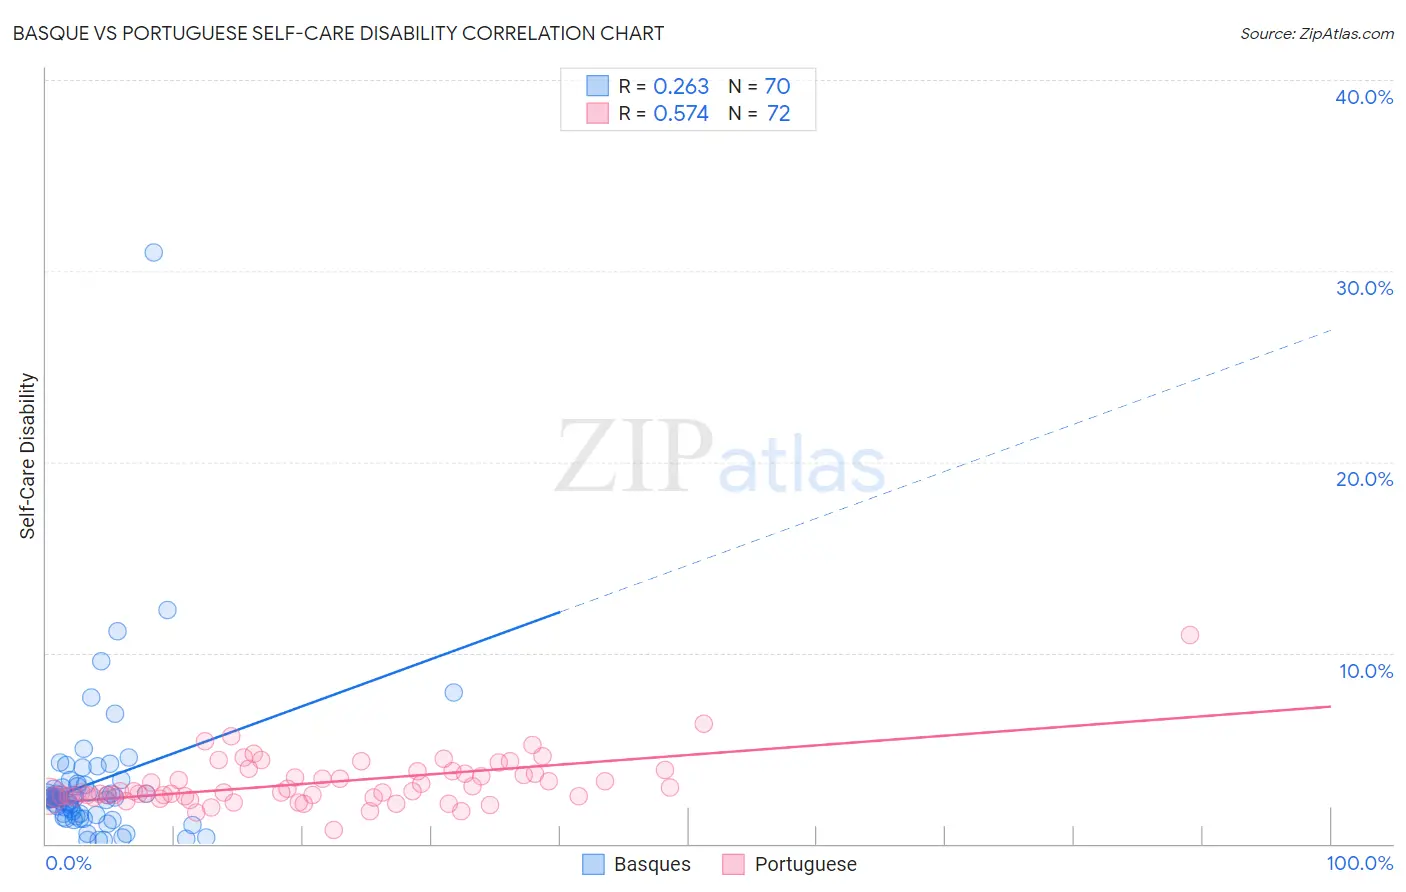
Basque vs Portuguese Self-Care Disability Correlation Chart
The statistical analysis conducted on geographies consisting of 165,703,684 people shows a weak positive correlation between the proportion of Basques and percentage of population with self-care disability in the United States with a correlation coefficient (R) of 0.263 and weighted average of 2.4%. Similarly, the statistical analysis conducted on geographies consisting of 449,515,942 people shows a substantial positive correlation between the proportion of Portuguese and percentage of population with self-care disability in the United States with a correlation coefficient (R) of 0.574 and weighted average of 2.6%, a difference of 7.8%.
Self-Care Disability Correlation Summary
| Measurement | Basque | Portuguese |
| Minimum | 0.19% | 0.74% |
| Maximum | 31.0% | 11.0% |
| Range | 30.8% | 10.2% |
| Mean | 3.2% | 3.2% |
| Median | 2.4% | 2.7% |
| Interquartile 25% (IQ1) | 1.5% | 2.5% |
| Interquartile 75% (IQ3) | 3.1% | 3.7% |
| Interquartile Range (IQR) | 1.5% | 1.3% |
| Standard Deviation (Sample) | 4.1% | 1.4% |
| Standard Deviation (Population) | 4.1% | 1.4% |
Similar Demographics by Self-Care Disability
Demographics Similar to Basques by Self-Care Disability
In terms of self-care disability, the demographic groups most similar to Basques are Tlingit-Haida (2.4%, a difference of 0.030%), Immigrants from England (2.4%, a difference of 0.030%), Immigrants from Costa Rica (2.4%, a difference of 0.070%), Arab (2.4%, a difference of 0.11%), and Italian (2.4%, a difference of 0.11%).
| Demographics | Rating | Rank | Self-Care Disability |
| Costa Ricans | 80.8 /100 | #144 | Excellent 2.4% |
| Germans | 80.1 /100 | #145 | Excellent 2.4% |
| Israelis | 80.0 /100 | #146 | Good 2.4% |
| Dutch | 77.5 /100 | #147 | Good 2.4% |
| Romanians | 75.8 /100 | #148 | Good 2.4% |
| Arabs | 75.7 /100 | #149 | Good 2.4% |
| Immigrants | Costa Rica | 75.1 /100 | #150 | Good 2.4% |
| Basques | 74.0 /100 | #151 | Good 2.4% |
| Tlingit-Haida | 73.5 /100 | #152 | Good 2.4% |
| Immigrants | England | 73.5 /100 | #153 | Good 2.4% |
| Italians | 72.2 /100 | #154 | Good 2.4% |
| Pakistanis | 71.4 /100 | #155 | Good 2.4% |
| Nigerians | 70.6 /100 | #156 | Good 2.4% |
| Immigrants | Europe | 69.6 /100 | #157 | Good 2.4% |
| Immigrants | Western Europe | 68.6 /100 | #158 | Good 2.4% |
Demographics Similar to Portuguese by Self-Care Disability
In terms of self-care disability, the demographic groups most similar to Portuguese are Mexican American Indian (2.6%, a difference of 0.080%), Immigrants from Liberia (2.6%, a difference of 0.080%), Immigrants from Bangladesh (2.6%, a difference of 0.15%), Immigrants from Haiti (2.6%, a difference of 0.23%), and Haitian (2.6%, a difference of 0.25%).
| Demographics | Rating | Rank | Self-Care Disability |
| Hawaiians | 0.8 /100 | #243 | Tragic 2.6% |
| Yuman | 0.8 /100 | #244 | Tragic 2.6% |
| Immigrants | Western Asia | 0.6 /100 | #245 | Tragic 2.6% |
| Cheyenne | 0.6 /100 | #246 | Tragic 2.6% |
| Immigrants | Albania | 0.6 /100 | #247 | Tragic 2.6% |
| Nicaraguans | 0.6 /100 | #248 | Tragic 2.6% |
| Mexican American Indians | 0.5 /100 | #249 | Tragic 2.6% |
| Portuguese | 0.4 /100 | #250 | Tragic 2.6% |
| Immigrants | Liberia | 0.4 /100 | #251 | Tragic 2.6% |
| Immigrants | Bangladesh | 0.4 /100 | #252 | Tragic 2.6% |
| Immigrants | Haiti | 0.3 /100 | #253 | Tragic 2.6% |
| Haitians | 0.3 /100 | #254 | Tragic 2.6% |
| Tsimshian | 0.3 /100 | #255 | Tragic 2.6% |
| Immigrants | Central America | 0.3 /100 | #256 | Tragic 2.6% |
| Potawatomi | 0.3 /100 | #257 | Tragic 2.6% |