Lumbee vs European Self-Care Disability
COMPARE
Lumbee
European
Self-Care Disability
Self-Care Disability Comparison
Lumbee
Europeans
3.0%
SELF-CARE DISABILITY
0.0/ 100
METRIC RATING
331st/ 347
METRIC RANK
2.4%
SELF-CARE DISABILITY
95.8/ 100
METRIC RATING
100th/ 347
METRIC RANK
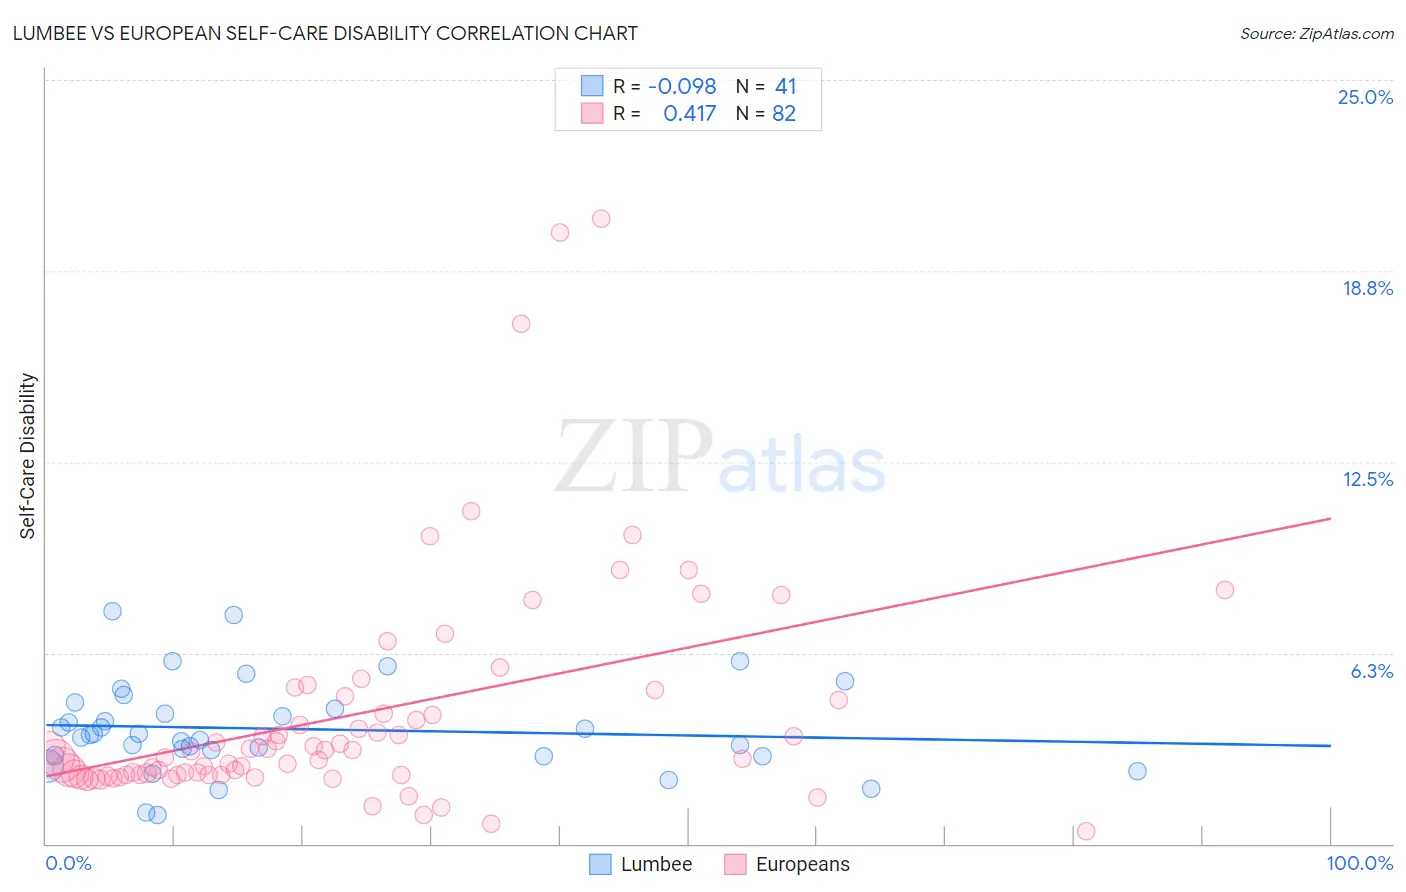
Lumbee vs European Self-Care Disability Correlation Chart
The statistical analysis conducted on geographies consisting of 92,217,287 people shows a slight negative correlation between the proportion of Lumbee and percentage of population with self-care disability in the United States with a correlation coefficient (R) of -0.098 and weighted average of 3.0%. Similarly, the statistical analysis conducted on geographies consisting of 559,811,147 people shows a moderate positive correlation between the proportion of Europeans and percentage of population with self-care disability in the United States with a correlation coefficient (R) of 0.417 and weighted average of 2.4%, a difference of 24.9%.
Self-Care Disability Correlation Summary
| Measurement | Lumbee | European |
| Minimum | 0.94% | 0.41% |
| Maximum | 7.6% | 20.5% |
| Range | 6.7% | 20.0% |
| Mean | 3.8% | 4.2% |
| Median | 3.6% | 2.9% |
| Interquartile 25% (IQ1) | 2.9% | 2.3% |
| Interquartile 75% (IQ3) | 4.5% | 4.7% |
| Interquartile Range (IQR) | 1.6% | 2.5% |
| Standard Deviation (Sample) | 1.5% | 3.7% |
| Standard Deviation (Population) | 1.5% | 3.7% |
Similar Demographics by Self-Care Disability
Demographics Similar to Lumbee by Self-Care Disability
In terms of self-care disability, the demographic groups most similar to Lumbee are Nepalese (3.0%, a difference of 0.12%), Kiowa (3.0%, a difference of 0.36%), Dutch West Indian (3.0%, a difference of 0.59%), Houma (3.0%, a difference of 0.66%), and Immigrants from the Azores (3.0%, a difference of 0.71%).
| Demographics | Rating | Rank | Self-Care Disability |
| Cherokee | 0.0 /100 | #324 | Tragic 2.9% |
| Immigrants | Uzbekistan | 0.0 /100 | #325 | Tragic 2.9% |
| Paiute | 0.0 /100 | #326 | Tragic 2.9% |
| Blacks/African Americans | 0.0 /100 | #327 | Tragic 2.9% |
| Hopi | 0.0 /100 | #328 | Tragic 2.9% |
| Cajuns | 0.0 /100 | #329 | Tragic 2.9% |
| Nepalese | 0.0 /100 | #330 | Tragic 3.0% |
| Lumbee | 0.0 /100 | #331 | Tragic 3.0% |
| Kiowa | 0.0 /100 | #332 | Tragic 3.0% |
| Dutch West Indians | 0.0 /100 | #333 | Tragic 3.0% |
| Houma | 0.0 /100 | #334 | Tragic 3.0% |
| Immigrants | Azores | 0.0 /100 | #335 | Tragic 3.0% |
| Immigrants | Yemen | 0.0 /100 | #336 | Tragic 3.0% |
| Choctaw | 0.0 /100 | #337 | Tragic 3.0% |
| Cape Verdeans | 0.0 /100 | #338 | Tragic 3.0% |
Demographics Similar to Europeans by Self-Care Disability
In terms of self-care disability, the demographic groups most similar to Europeans are Immigrants from Scotland (2.4%, a difference of 0.040%), Immigrants from Israel (2.4%, a difference of 0.10%), Immigrants from Poland (2.4%, a difference of 0.18%), Croatian (2.4%, a difference of 0.22%), and Alsatian (2.4%, a difference of 0.25%).
| Demographics | Rating | Rank | Self-Care Disability |
| Immigrants | Latvia | 97.0 /100 | #93 | Exceptional 2.4% |
| Macedonians | 96.9 /100 | #94 | Exceptional 2.4% |
| Immigrants | Asia | 96.9 /100 | #95 | Exceptional 2.4% |
| Immigrants | Chile | 96.7 /100 | #96 | Exceptional 2.4% |
| Swiss | 96.6 /100 | #97 | Exceptional 2.4% |
| Immigrants | Poland | 96.4 /100 | #98 | Exceptional 2.4% |
| Immigrants | Israel | 96.1 /100 | #99 | Exceptional 2.4% |
| Europeans | 95.8 /100 | #100 | Exceptional 2.4% |
| Immigrants | Scotland | 95.7 /100 | #101 | Exceptional 2.4% |
| Croatians | 95.0 /100 | #102 | Exceptional 2.4% |
| Alsatians | 94.9 /100 | #103 | Exceptional 2.4% |
| Bhutanese | 94.5 /100 | #104 | Exceptional 2.4% |
| Carpatho Rusyns | 94.4 /100 | #105 | Exceptional 2.4% |
| Immigrants | Indonesia | 94.3 /100 | #106 | Exceptional 2.4% |
| British | 94.3 /100 | #107 | Exceptional 2.4% |