Immigrants from St. Vincent and the Grenadines vs European Self-Care Disability
COMPARE
Immigrants from St. Vincent and the Grenadines
European
Self-Care Disability
Self-Care Disability Comparison
Immigrants from St. Vincent and the Grenadines
Europeans
2.8%
SELF-CARE DISABILITY
0.0/ 100
METRIC RATING
302nd/ 347
METRIC RANK
2.4%
SELF-CARE DISABILITY
95.8/ 100
METRIC RATING
100th/ 347
METRIC RANK
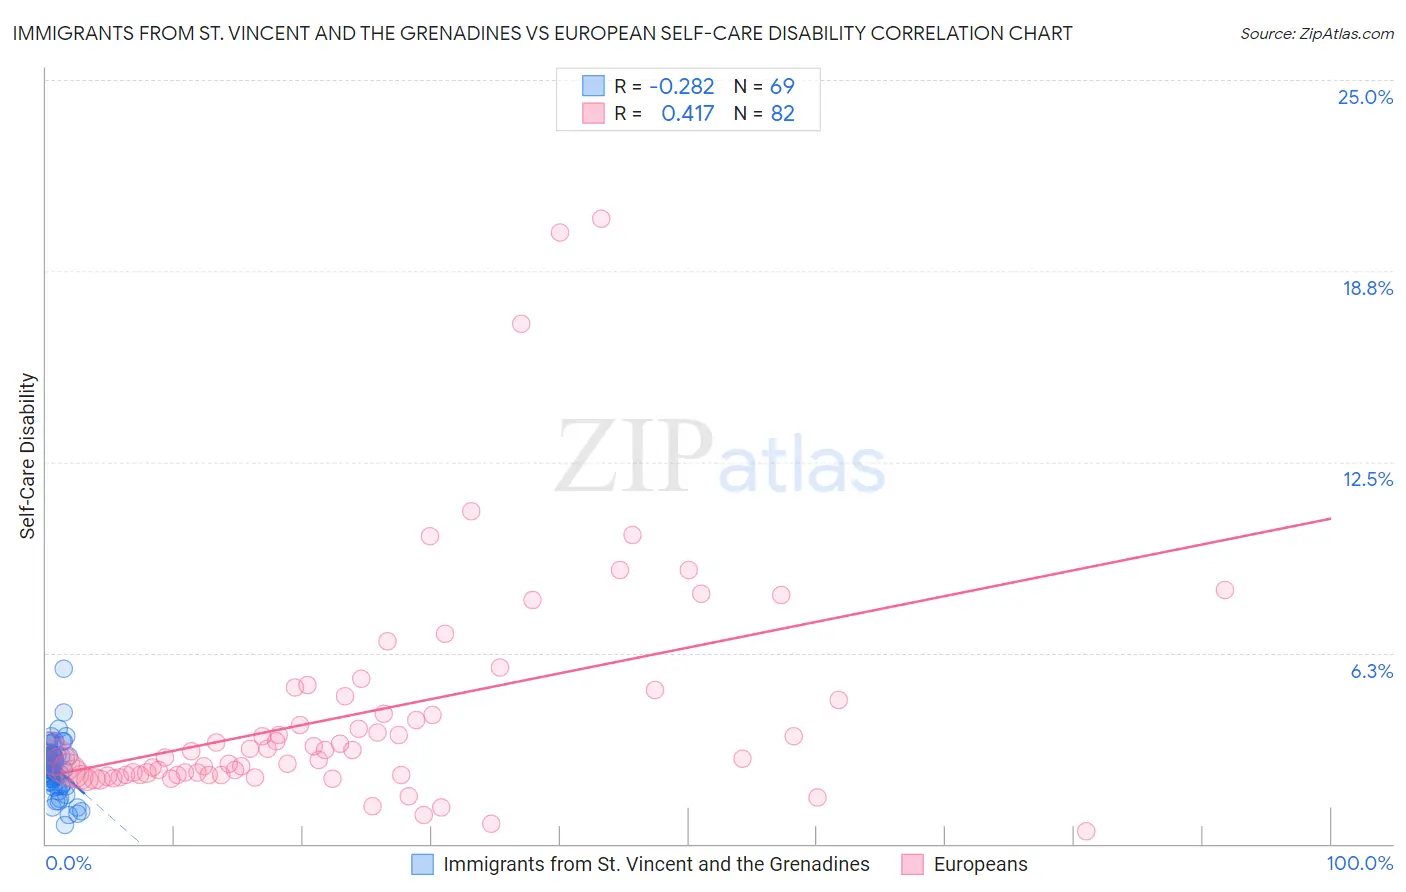
Immigrants from St. Vincent and the Grenadines vs European Self-Care Disability Correlation Chart
The statistical analysis conducted on geographies consisting of 56,160,943 people shows a weak negative correlation between the proportion of Immigrants from St. Vincent and the Grenadines and percentage of population with self-care disability in the United States with a correlation coefficient (R) of -0.282 and weighted average of 2.8%. Similarly, the statistical analysis conducted on geographies consisting of 559,811,147 people shows a moderate positive correlation between the proportion of Europeans and percentage of population with self-care disability in the United States with a correlation coefficient (R) of 0.417 and weighted average of 2.4%, a difference of 17.2%.
Self-Care Disability Correlation Summary
| Measurement | Immigrants from St. Vincent and the Grenadines | European |
| Minimum | 0.61% | 0.41% |
| Maximum | 5.7% | 20.5% |
| Range | 5.1% | 20.0% |
| Mean | 2.5% | 4.2% |
| Median | 2.5% | 2.9% |
| Interquartile 25% (IQ1) | 2.0% | 2.3% |
| Interquartile 75% (IQ3) | 2.9% | 4.7% |
| Interquartile Range (IQR) | 0.89% | 2.5% |
| Standard Deviation (Sample) | 0.82% | 3.7% |
| Standard Deviation (Population) | 0.82% | 3.7% |
Similar Demographics by Self-Care Disability
Demographics Similar to Immigrants from St. Vincent and the Grenadines by Self-Care Disability
In terms of self-care disability, the demographic groups most similar to Immigrants from St. Vincent and the Grenadines are Pima (2.8%, a difference of 0.040%), Immigrants from Fiji (2.8%, a difference of 0.13%), Immigrants from Belize (2.8%, a difference of 0.15%), Cree (2.8%, a difference of 0.30%), and Immigrants from West Indies (2.8%, a difference of 0.35%).
| Demographics | Rating | Rank | Self-Care Disability |
| Barbadians | 0.0 /100 | #295 | Tragic 2.7% |
| Immigrants | Portugal | 0.0 /100 | #296 | Tragic 2.8% |
| West Indians | 0.0 /100 | #297 | Tragic 2.8% |
| Americans | 0.0 /100 | #298 | Tragic 2.8% |
| Immigrants | Guyana | 0.0 /100 | #299 | Tragic 2.8% |
| Immigrants | Fiji | 0.0 /100 | #300 | Tragic 2.8% |
| Pima | 0.0 /100 | #301 | Tragic 2.8% |
| Immigrants | St. Vincent and the Grenadines | 0.0 /100 | #302 | Tragic 2.8% |
| Immigrants | Belize | 0.0 /100 | #303 | Tragic 2.8% |
| Cree | 0.0 /100 | #304 | Tragic 2.8% |
| Immigrants | West Indies | 0.0 /100 | #305 | Tragic 2.8% |
| Aleuts | 0.0 /100 | #306 | Tragic 2.8% |
| Natives/Alaskans | 0.0 /100 | #307 | Tragic 2.8% |
| Immigrants | Grenada | 0.0 /100 | #308 | Tragic 2.8% |
| Bangladeshis | 0.0 /100 | #309 | Tragic 2.8% |
Demographics Similar to Europeans by Self-Care Disability
In terms of self-care disability, the demographic groups most similar to Europeans are Immigrants from Scotland (2.4%, a difference of 0.040%), Immigrants from Israel (2.4%, a difference of 0.10%), Immigrants from Poland (2.4%, a difference of 0.18%), Croatian (2.4%, a difference of 0.22%), and Alsatian (2.4%, a difference of 0.25%).
| Demographics | Rating | Rank | Self-Care Disability |
| Immigrants | Latvia | 97.0 /100 | #93 | Exceptional 2.4% |
| Macedonians | 96.9 /100 | #94 | Exceptional 2.4% |
| Immigrants | Asia | 96.9 /100 | #95 | Exceptional 2.4% |
| Immigrants | Chile | 96.7 /100 | #96 | Exceptional 2.4% |
| Swiss | 96.6 /100 | #97 | Exceptional 2.4% |
| Immigrants | Poland | 96.4 /100 | #98 | Exceptional 2.4% |
| Immigrants | Israel | 96.1 /100 | #99 | Exceptional 2.4% |
| Europeans | 95.8 /100 | #100 | Exceptional 2.4% |
| Immigrants | Scotland | 95.7 /100 | #101 | Exceptional 2.4% |
| Croatians | 95.0 /100 | #102 | Exceptional 2.4% |
| Alsatians | 94.9 /100 | #103 | Exceptional 2.4% |
| Bhutanese | 94.5 /100 | #104 | Exceptional 2.4% |
| Carpatho Rusyns | 94.4 /100 | #105 | Exceptional 2.4% |
| Immigrants | Indonesia | 94.3 /100 | #106 | Exceptional 2.4% |
| British | 94.3 /100 | #107 | Exceptional 2.4% |