Alsatian vs Russian Female Poverty
COMPARE
Alsatian
Russian
Female Poverty
Female Poverty Comparison
Alsatians
Russians
14.5%
FEMALE POVERTY
4.0/ 100
METRIC RATING
220th/ 347
METRIC RANK
11.8%
FEMALE POVERTY
99.3/ 100
METRIC RATING
38th/ 347
METRIC RANK
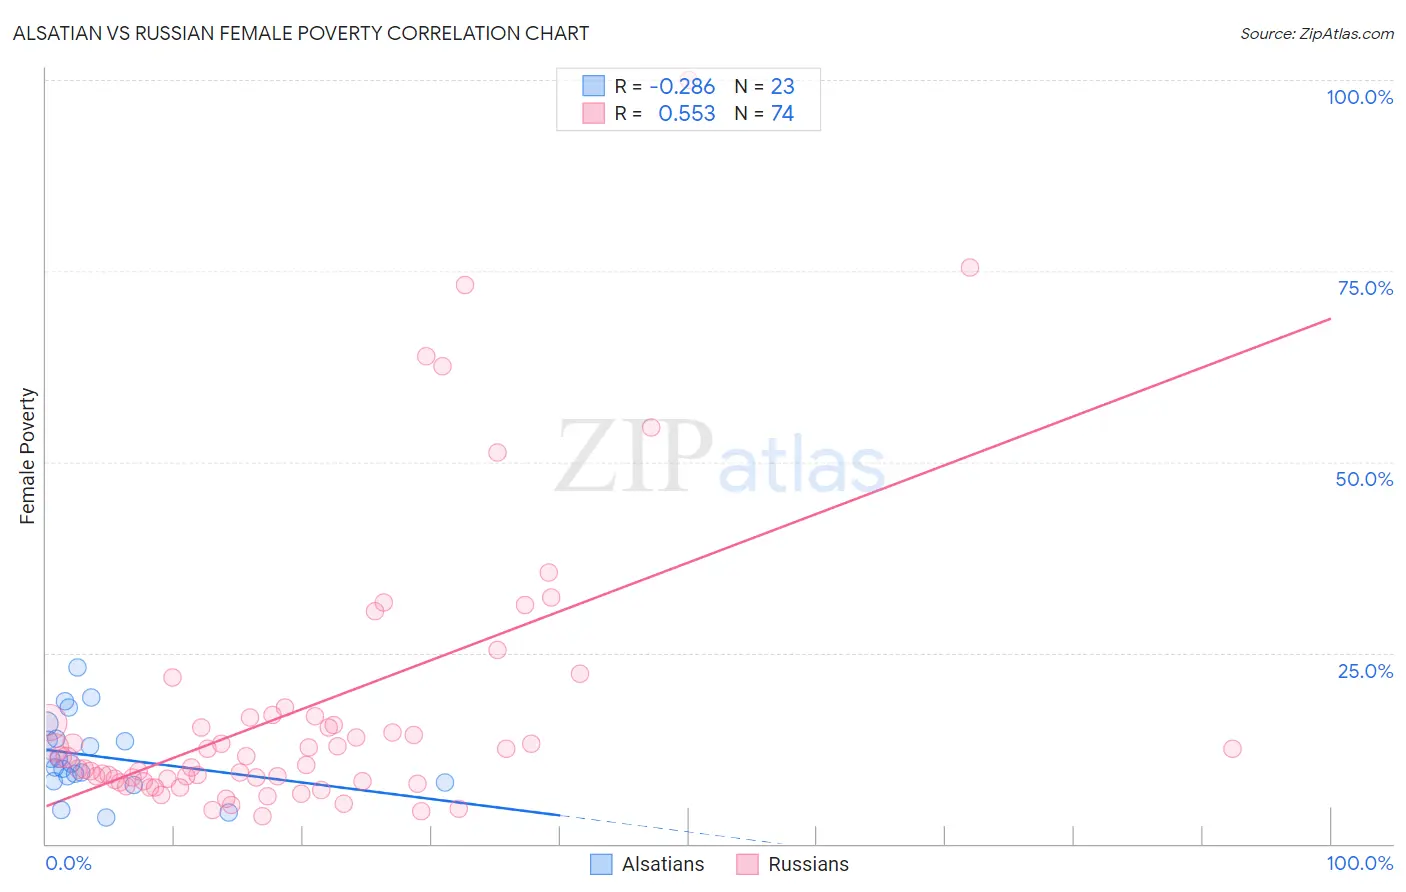
Alsatian vs Russian Female Poverty Correlation Chart
The statistical analysis conducted on geographies consisting of 82,678,421 people shows a weak negative correlation between the proportion of Alsatians and poverty level among females in the United States with a correlation coefficient (R) of -0.286 and weighted average of 14.5%. Similarly, the statistical analysis conducted on geographies consisting of 511,408,549 people shows a substantial positive correlation between the proportion of Russians and poverty level among females in the United States with a correlation coefficient (R) of 0.553 and weighted average of 11.8%, a difference of 22.4%.
Female Poverty Correlation Summary
| Measurement | Alsatian | Russian |
| Minimum | 3.4% | 3.6% |
| Maximum | 23.1% | 100.0% |
| Range | 19.7% | 96.4% |
| Mean | 11.5% | 17.7% |
| Median | 10.5% | 11.4% |
| Interquartile 25% (IQ1) | 8.2% | 8.2% |
| Interquartile 75% (IQ3) | 13.7% | 16.5% |
| Interquartile Range (IQR) | 5.5% | 8.2% |
| Standard Deviation (Sample) | 5.0% | 18.5% |
| Standard Deviation (Population) | 4.9% | 18.4% |
Similar Demographics by Female Poverty
Demographics Similar to Alsatians by Female Poverty
In terms of female poverty, the demographic groups most similar to Alsatians are Japanese (14.5%, a difference of 0.050%), Immigrants from Uzbekistan (14.4%, a difference of 0.18%), Immigrants from Cambodia (14.5%, a difference of 0.19%), Nonimmigrants (14.5%, a difference of 0.22%), and Immigrants (14.4%, a difference of 0.23%).
| Demographics | Rating | Rank | Female Poverty |
| Alaskan Athabascans | 5.3 /100 | #213 | Tragic 14.4% |
| Marshallese | 5.0 /100 | #214 | Tragic 14.4% |
| Immigrants | Panama | 4.7 /100 | #215 | Tragic 14.4% |
| Immigrants | Thailand | 4.5 /100 | #216 | Tragic 14.4% |
| Immigrants | Immigrants | 4.5 /100 | #217 | Tragic 14.4% |
| Immigrants | Uzbekistan | 4.4 /100 | #218 | Tragic 14.4% |
| Japanese | 4.1 /100 | #219 | Tragic 14.5% |
| Alsatians | 4.0 /100 | #220 | Tragic 14.5% |
| Immigrants | Cambodia | 3.7 /100 | #221 | Tragic 14.5% |
| Immigrants | Nonimmigrants | 3.7 /100 | #222 | Tragic 14.5% |
| Immigrants | Africa | 3.3 /100 | #223 | Tragic 14.5% |
| Americans | 2.8 /100 | #224 | Tragic 14.6% |
| Immigrants | Micronesia | 2.8 /100 | #225 | Tragic 14.6% |
| Immigrants | Eritrea | 2.4 /100 | #226 | Tragic 14.6% |
| Immigrants | Nigeria | 2.1 /100 | #227 | Tragic 14.7% |
Demographics Similar to Russians by Female Poverty
In terms of female poverty, the demographic groups most similar to Russians are Immigrants from Greece (11.8%, a difference of 0.020%), Immigrants from Pakistan (11.8%, a difference of 0.11%), Immigrants from Poland (11.8%, a difference of 0.21%), Macedonian (11.8%, a difference of 0.26%), and Immigrants from Iran (11.8%, a difference of 0.28%).
| Demographics | Rating | Rank | Female Poverty |
| Poles | 99.5 /100 | #31 | Exceptional 11.7% |
| Danes | 99.5 /100 | #32 | Exceptional 11.7% |
| Cypriots | 99.5 /100 | #33 | Exceptional 11.8% |
| Immigrants | Singapore | 99.4 /100 | #34 | Exceptional 11.8% |
| Immigrants | Iran | 99.4 /100 | #35 | Exceptional 11.8% |
| Immigrants | Pakistan | 99.4 /100 | #36 | Exceptional 11.8% |
| Immigrants | Greece | 99.3 /100 | #37 | Exceptional 11.8% |
| Russians | 99.3 /100 | #38 | Exceptional 11.8% |
| Immigrants | Poland | 99.3 /100 | #39 | Exceptional 11.8% |
| Macedonians | 99.3 /100 | #40 | Exceptional 11.8% |
| Czechs | 99.2 /100 | #41 | Exceptional 11.9% |
| Immigrants | Moldova | 99.2 /100 | #42 | Exceptional 11.9% |
| Koreans | 99.2 /100 | #43 | Exceptional 11.9% |
| Tongans | 99.2 /100 | #44 | Exceptional 11.9% |
| Immigrants | Czechoslovakia | 99.2 /100 | #45 | Exceptional 11.9% |